Coronavirus cases dropped 15% to 330,000 in first week of lockdown – England
Coronavirus infections fell in every region and age group except toddlers in England last week, Public Health England data shows, after a mass study claimed cases rose over the first ten days of lockdown.
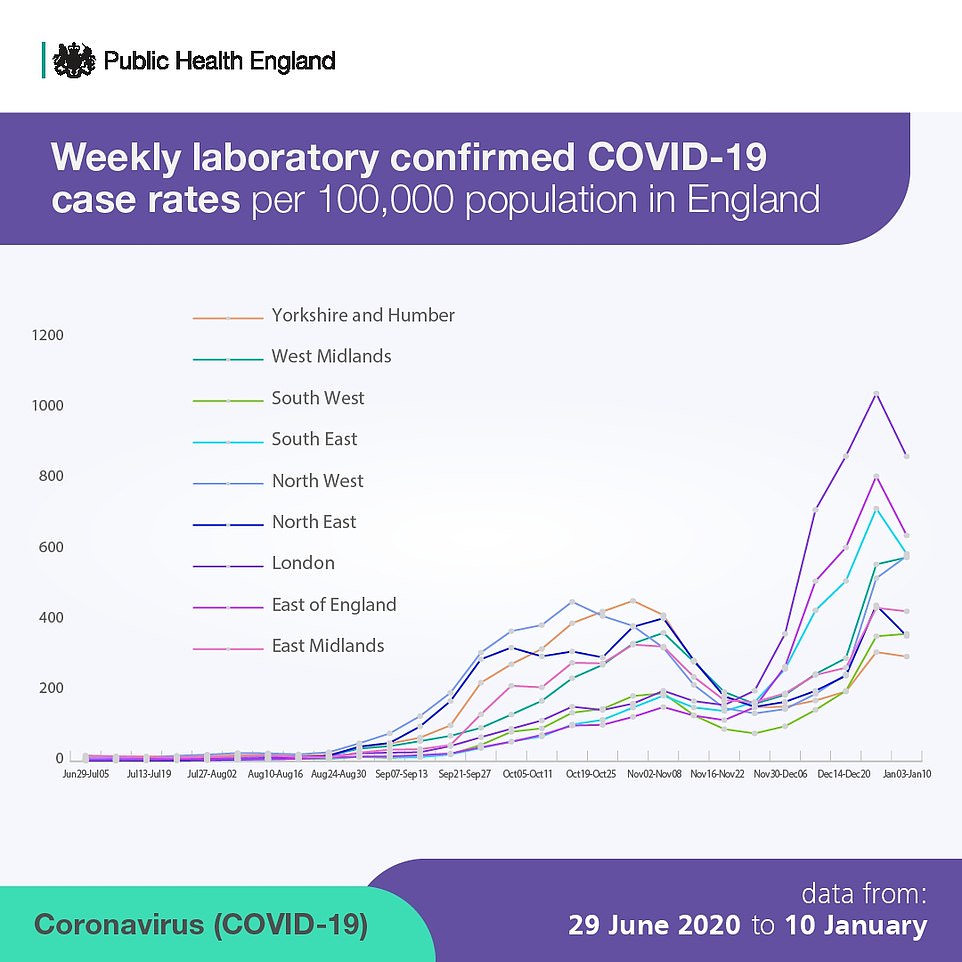
Covid-19 hotspot London saw the sharpest drop in its infection rate by a quarter, the report suggests, followed by the East of England and the South East. The regions were the first into Tier Four measures days before Christmas.
And in another promising sign those aged over 60 – who are most at risk of hospitalisation and death if they catch the virus – were suggested to have a 20 per cent drop in their infection rate, the third largest drop in England.
The surveillance report statistics are yet more evidence that the country’s coronavirus outbreak has been shrinking since the beginning of the new year.
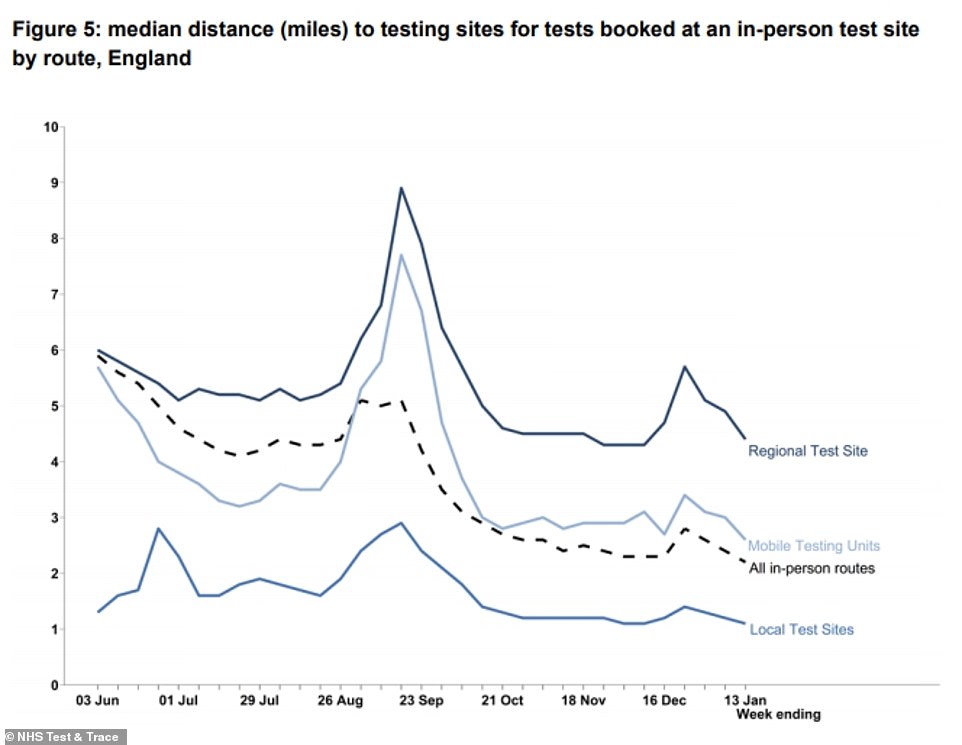
NHS Test and Trace data also published today showed a 15 per cent decline in the number of people testing positive for the virus across the UK in the week ending January 13.
There were 330,871 people who tested positive for coronavirus across the country during the week ending January 13. For comparison, the figure stood at 389,191 in the first week of 2021.
It is the first week-on-week fall since the beginning of December, when cases dipped as England emerged from its second national lockdown. It can take up to a week for the effect of any restrictions to be reflected in the data, meaning the drop in cases may have also been fuelled by the original tiered measures.
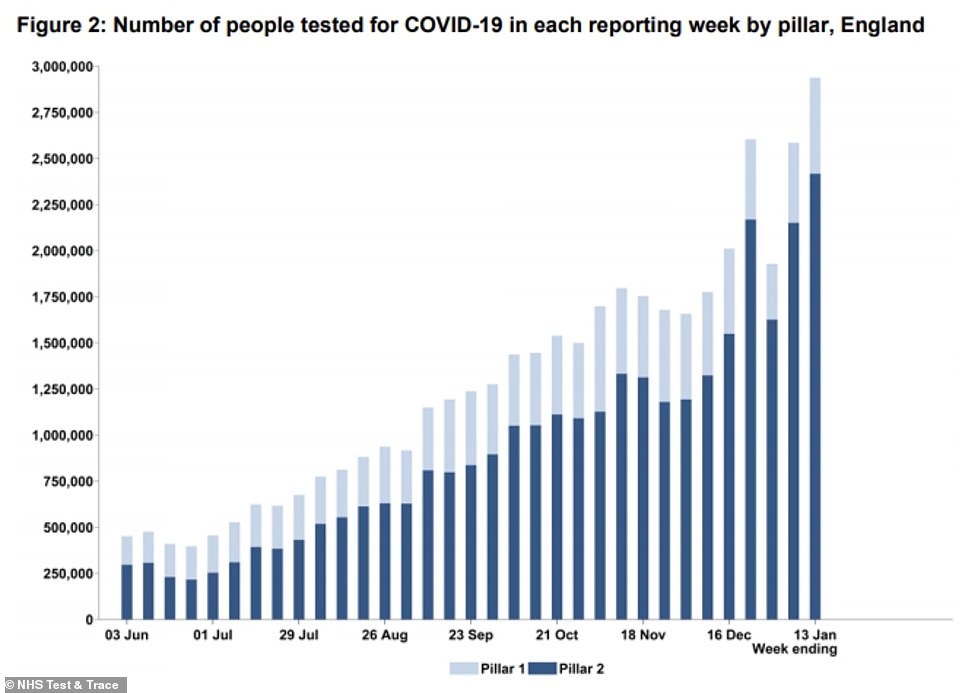
It has been suggested that falls could be due to fewer tests being carried out. But the latest figures show this is not the case – an extra 400,000 swabs were analysed in the most recent seven-day spell and the number of positives still dropped. It is another promising sign that the third lockdown, which began on January 5, is bringing England’s outbreak under control.
Although cases are high with tens of thousands more cases every day, infections have stopped rising at the rate they were in December when the virus was out of control.
The figures come after a shocking study today sparked fears England’s third lockdown was failing to curb cases, after Imperial College London’s REACT-1 mass-testing project estimated 1.58 per cent of England’s population had coronavirus in the first 10 days of lockdown – up from 0.91 per cent in early December.
But scientists dismissed concerns that even tighter measures were needed, saying the Imperial study does not prove infections are rising because it missed out a drop from the second wave’s likely peak in late December.
Researchers behind the study did not carry out the survey over this period, which is when official data suggests coronavirus cases reached their high point before beginning to drop.
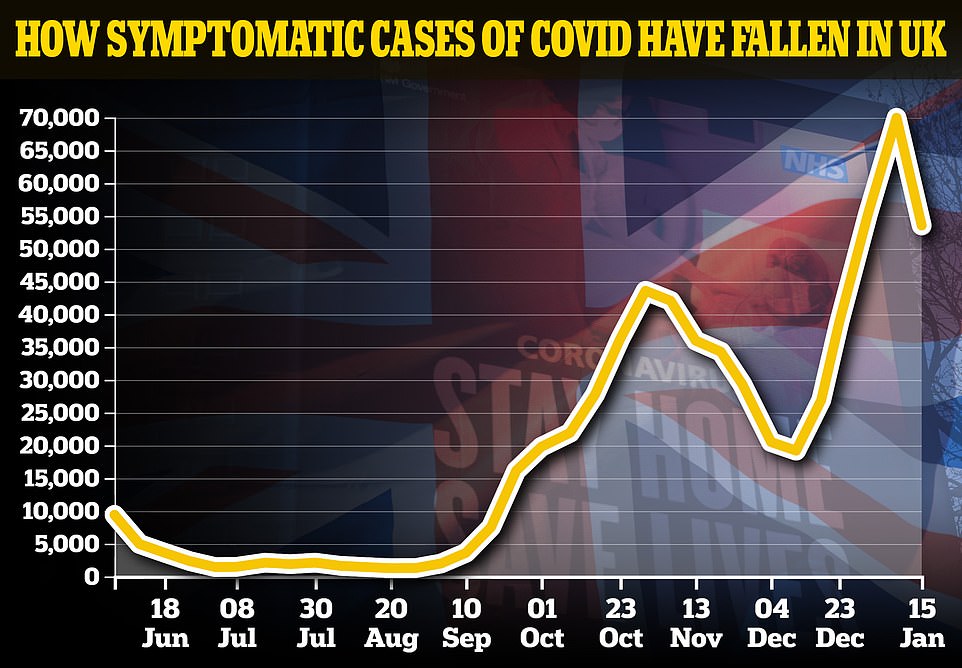
Other studies tracking the Covid outbreak suggest more optimistic trends. Even Department of Health statistics show daily infections have plunged since the start of the lockdown, from an average of almost 60,000 to 40,000.
Cambridge University estimates show that the R rate of the virus is likely below one, while Public Health England last week claimed cases dropped in all age groups. King’s College researchers also say cases have fallen ‘steadily’ since the New Year.
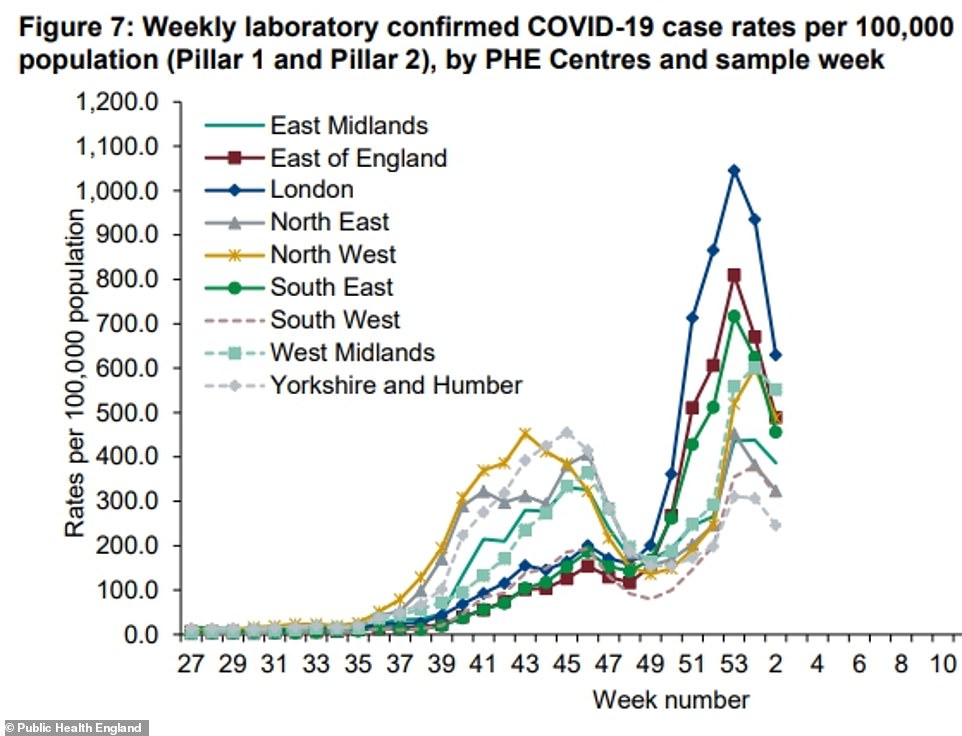
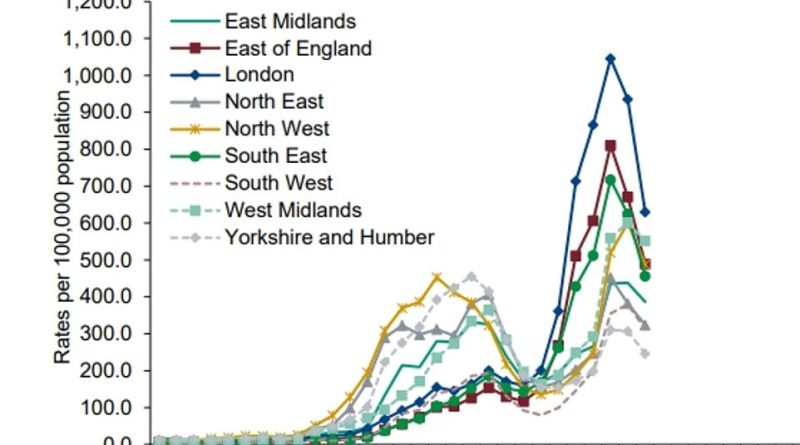
Official statistics from Public Health England show coronavirus infections dropped in every region of England in the week to January 17. Above is the graph showing the sharpest drop in London
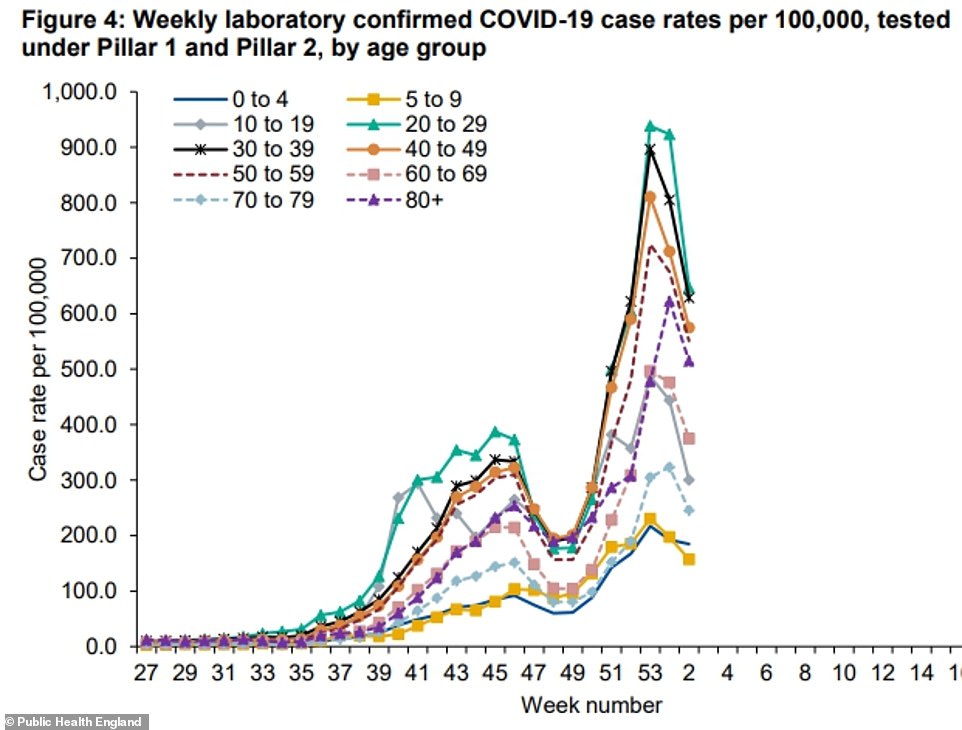
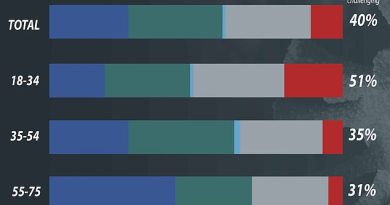
And infections are also thought to have declined in every group except toddlers, the latest PHE data suggests

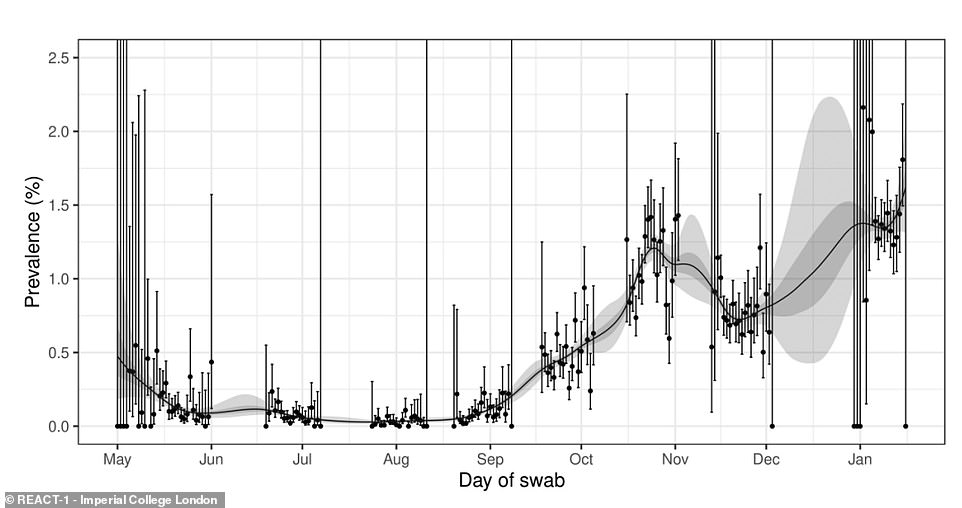
Random swabbing of 142,000 people between January 6 to 15 found ‘no evidence’ of a decline in infection levels — despite an array of promising data showing exactly the opposite. The graph shows the test positivity rate for every day of the study
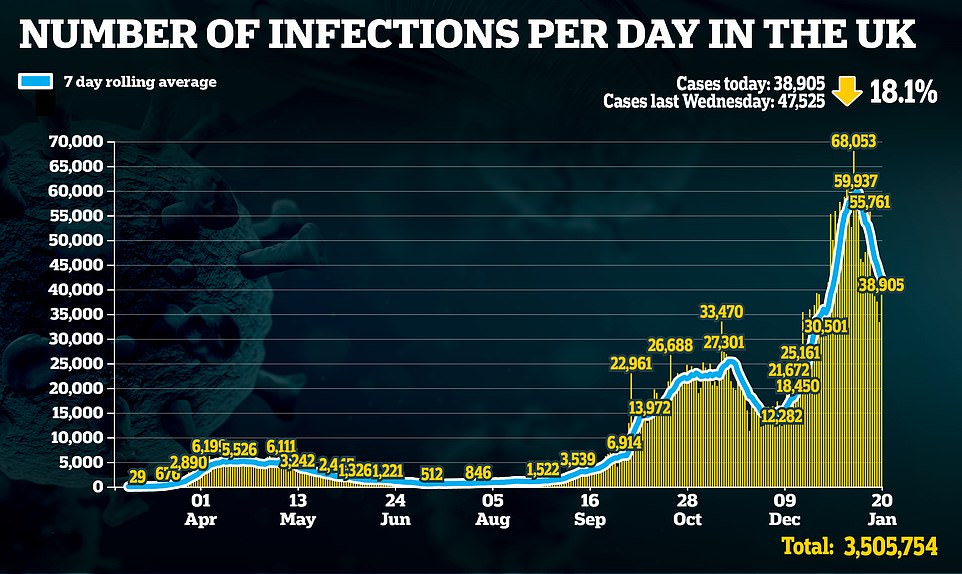

Public Health England data shows that the numbers of people getting positive coronavirus test results through the official swab-testing scheme has clearly been coming down since the start of January
Public Health England’s weekly surveillance report shows Covid-19 infections dipped in the capital from 864 to 629 cases per 100,000 people in the week ending January 17, a 27 per cent decline.
But the capital still had the highest proportion of its population infected in England.
The second highest drop was in the East of England, where the infection rate per 100,000 fell to 489 after declining by 24 per cent.
And the third highest was in the South East, where the infection rate fell by 22 per cent to 456 per 100,000.
Experts behind the Imperial surveillance study said the numbers appeared to plateau between January 5 and 16. One of the researchers said it ‘doesn’t support the conclusion that lockdown is working’.
However, other scientists today insisted the findings do not prove that infections are rising because it missed out a drop from the second wave’s likely peak in December.
Imperial’s team didn’t test anyone between December 3 and January 6, leaving a huge gap in their picture of how England’s outbreak changed during the worst of the second wave.
During that time a new fast-spreading variant took hold in the south, Tier 4 was introduced for millions of people, household mixing was allowed for the first time in months for millions of others on Christmas Day, hospital patient numbers surged to record high levels, and the third lockdown was triggered.
The REACT study then re-emerged on January 6, finding that the proportion of people infected with the virus had doubled since it last checked at the start of December, and wasn’t showing sure signs of decline.
The researchers behind it admit they missed the peak and so did not record a downturn in the infection rate, and say they hoped further testing in January would show infection numbers come down as the effects of lockdown properly set in.
Experts have suggested the third lockdown may be slower to act because the virus has become able to spread faster and people are becoming weary of rules and not following them as strictly.
Other scientists say the study — which is considered one of the most accurate measures of the spread of Covid because it tests asymptomatic people — doesn’t have enough data to draw firm conclusions about whether lockdown was working in the first 10 days.
And Education Secretary Gavin Williamson today said other statistics given to the Government show lockdown ‘has been having an impact in terms of relieving some of that pressure on the NHS’.
Professor Tim Spector, a King’s College London epidemiologist who is running his own Covid Symptom Study using constantly updating data from a mobile app, told MailOnline the Imperial researchers ‘can’t really judge the effects of lockdown with their survey’.
Professor Kevin McConway, a statistician at the Open University, added that there is ‘certainly quite a strong possibility that the REACT-1 estimates are not very accurate’.
Other studies looking at the effects of Covid-19 across the country suggest more optimistic trends.
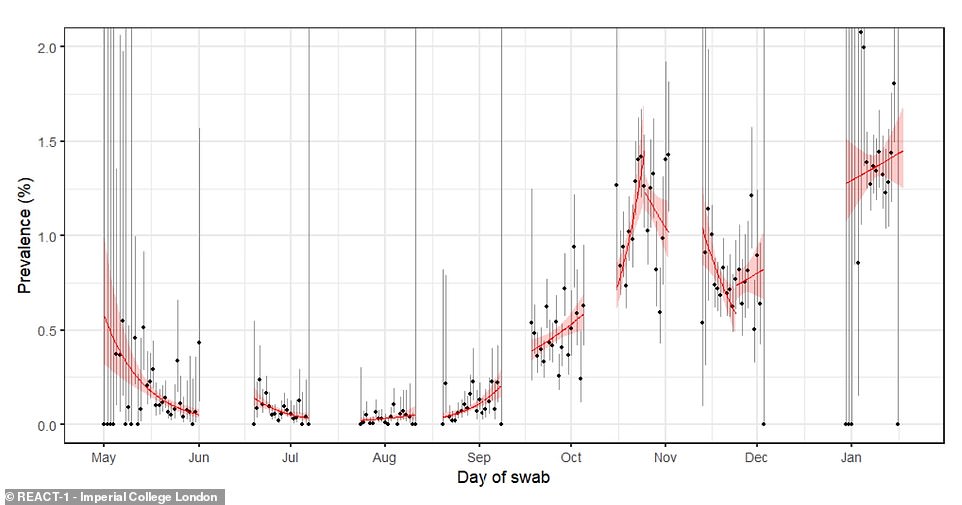
The Imperial College London study missed out a long period of testing during December. By the start of the lockdown in January it found that 1.58 per cent of people in England were infected with coronavirus — the equivalent of almost 900,000 people. The graph shows the general trend across each time period the study has been carried out for, with the red line pointing upwards in the most recent week. The large area of red shading around the line, which peaks on both sides, shows that scientists are very uncertain about what the data means and it could actually be going down, flat, or going up
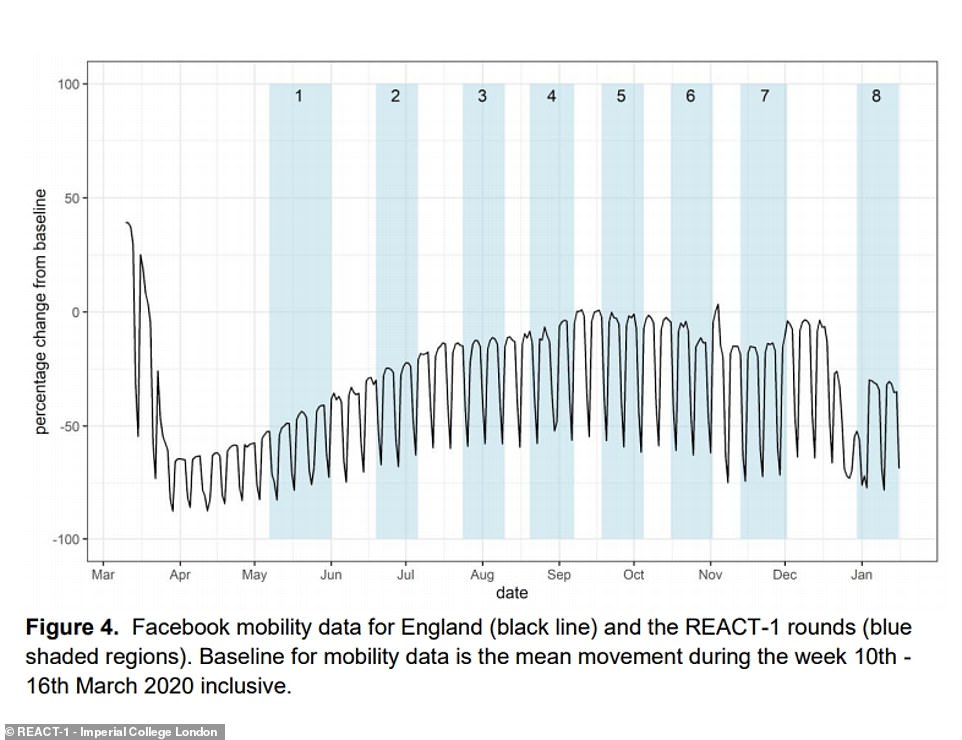
It found that mobility data suggested people were moving around more since the start of January, meaning even tougher restrictions may be necessary
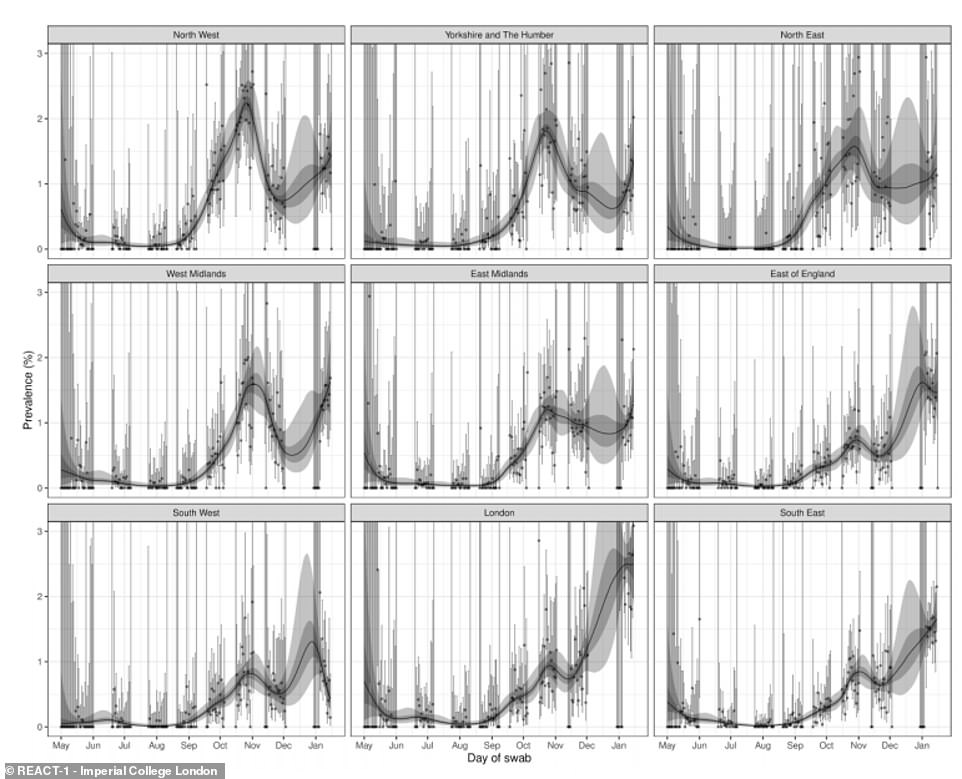
The Imperial College London team also revealed how test positivity rates varied across each region of England over the study period, with rates falling in the East and South West and plateauing in London
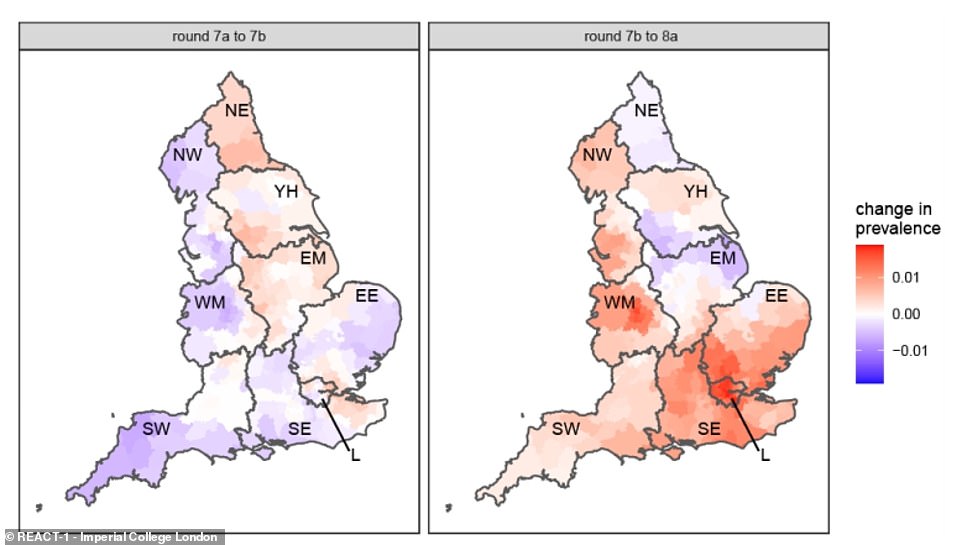
And the team also offered a heat map showing where outbreaks have grown or shrunk between the last two recent rounds of testing
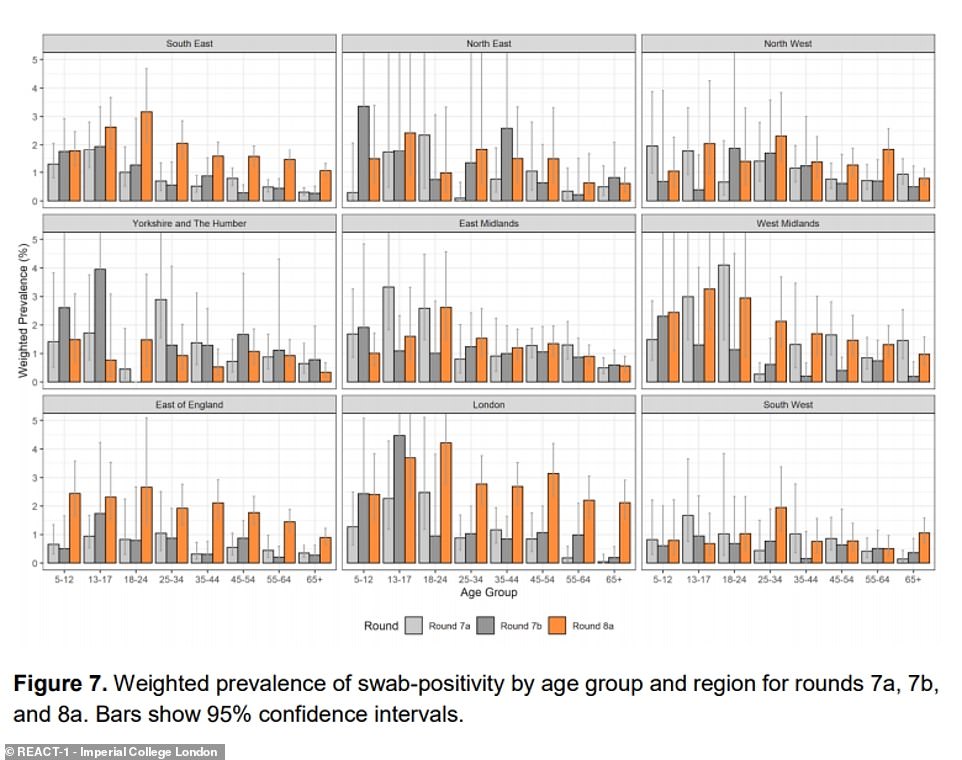
Experts behind the REACT-1 study also revealed how test positivity rates varied between age groups for each region, over the last three rounds of testing
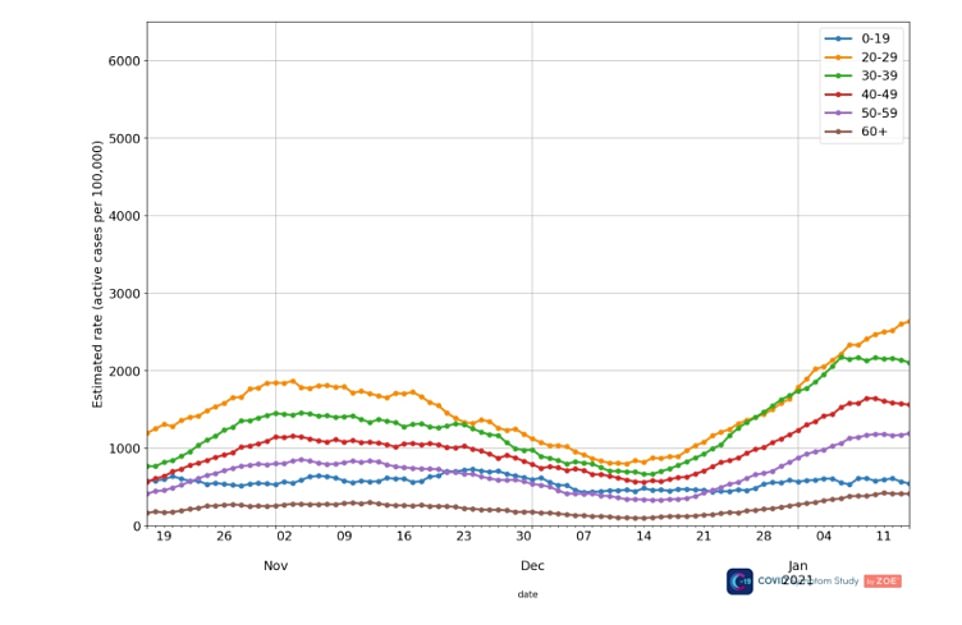
Above is the case rates by age groups in the UK. The highest levels are in the 20-29 and 30-39 age groups, data from the ZOE Covid-19 study shows
Cambridge University estimates last week showed that the R rate of the virus is likely below one and could be as low as 0.6 in London.
Public Health England revealed weekly coronavirus cases had fallen in all age groups except the over-80s.
And Department of Health figures showed that dozens of boroughs had experienced a drop in infection rates.
Health Secretary Matt Hancock seized on the Imperial findings to hammer home the lockdown message and said they show ‘why we must not let down our guard over the weeks to come’.
He added: ‘Infections across England are at very high levels and this will keep having a knock-on effect on the already significant pressures faced by our NHS and hospitals.
‘It is absolutely paramount that everyone plays their part to bring down infections.’
But experts aren’t sure that the data is comprehensive enough to give any accurate idea of trends in how the virus is spreading.
Professor Tim Spector, who has been monitoring the coronavirus outbreak since the pandemic began, said there were ‘problems’ with REACT’s figures because it ‘did not collect any data for a month from December 5 to January 6’.
‘So, it’s very hard for them to tell what the trends are,’ Professor Spector told MailOnline.