Coronavirus London: Lockdown fears as hospital admissions triple
[ad_1]
London is thought to be on the brink of a localised lockdown — but official figures show the outbreak may finally be slowing down, despite hospital admissions for coronavirus having tripled in a fortnight and public health chiefs warning of a ‘rising tide’ of the virus in the capital.
During a behind-closed-doors briefing this week, Kevin Fenton, director of Public Health England in the capital, told London mayor Sadiq Khan and the leaders of all 32 boroughs that all signs indicated the disease was making a rapid resurgence in the city.
Ministers are now said to be mulling a decision to place more than 9million people in the city under even tighter restrictions, if the new suite of national social distancing measures announced by the Government this week fail to curb climbing numbers.
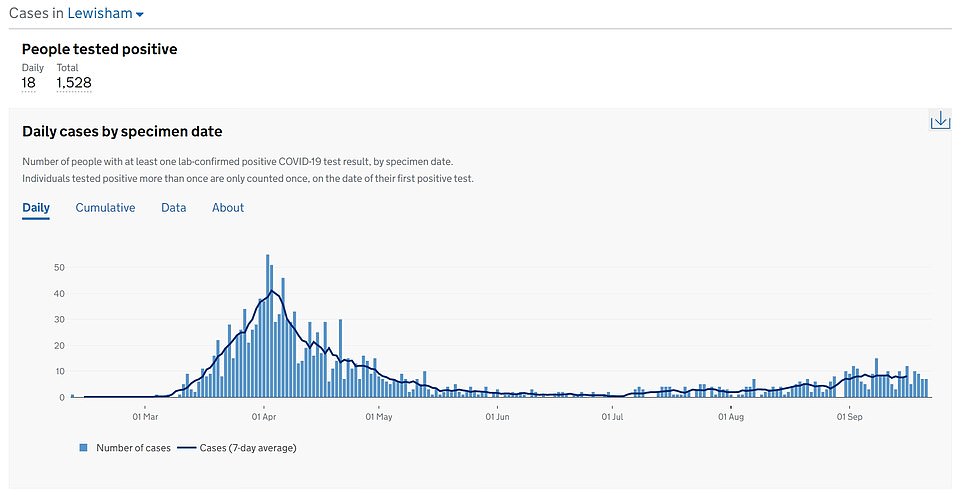
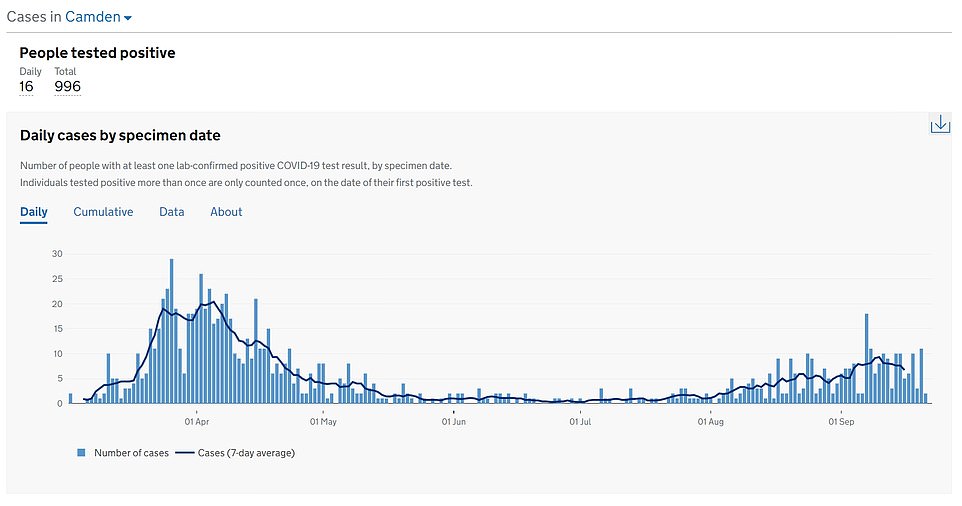
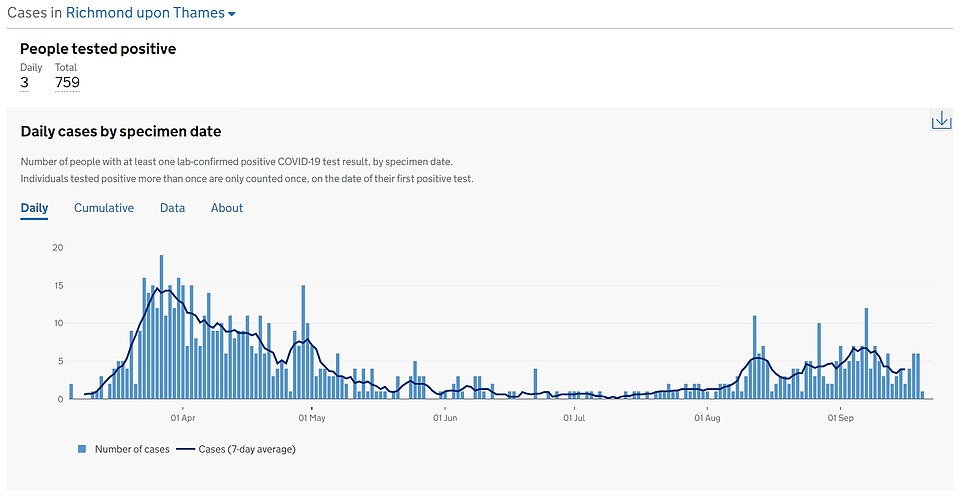
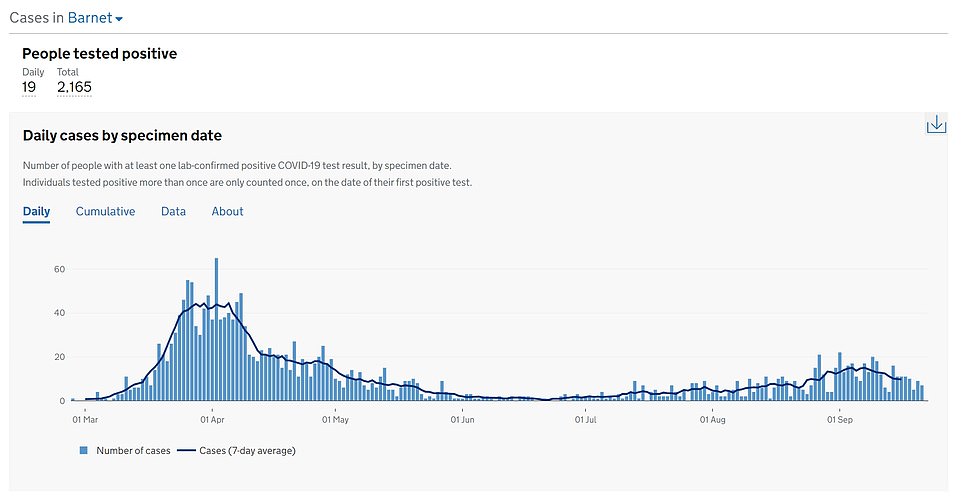
Infections across the city has more than doubled since August, with the seven-day weekly average number of cases rising from 86 per 100,000 to 262 per 100,000. But official figures show that upticks in cases have ground to a halt across the capital, with only a handful of boroughs now seeing a sustained rise in infections — including Redbridge and Barking and Dagenham, two of the three worst-hit parts of the capital.
It’s true that Covid-19 hospital admissions in the capital have tripled in a fortnight, with the rolling average rising from 11 on September 2 to 33.4 by September 18. But the number of hospitalisations in the city is still a far cry from the 700-plus at the height of the pandemic in spring and only slightly higher than they were the start of July (around 25), when the country was deemed safe to reopen again. For comparison, 13 times as many admissions were being recorded in March (425 on March 22) — before the national lockdown was imposed.
And the most up-to-date statistics released by Public Health England, which cover the week ending September 18, reveal that just a single borough in the capital — Redbridge — ranks among the top 40 worst-hit regions of the country. The Government will publish its latest batch of figures on infections tomorrow.
However, Professor Fenton argued testing infrastructure had been stripped out of the capital and reallocated to hotspots in the north, meaning many Londoners may have gone undiagnosed. But the latest Department of Health figures show testing in London’s Covid-19 hotspots has actually increased week-on-week.
Analysis of the statistics by MailOnline found Barking carried out 2,669 swabs in the week ending September 16, 25 per cent more than the week before, when 2,036 swabs were done. In Redbridge, 3,370 residents were checked for the virus in the latest reporting period, compared to 3,046 the week prior, a rise of nearly 10 per cent.
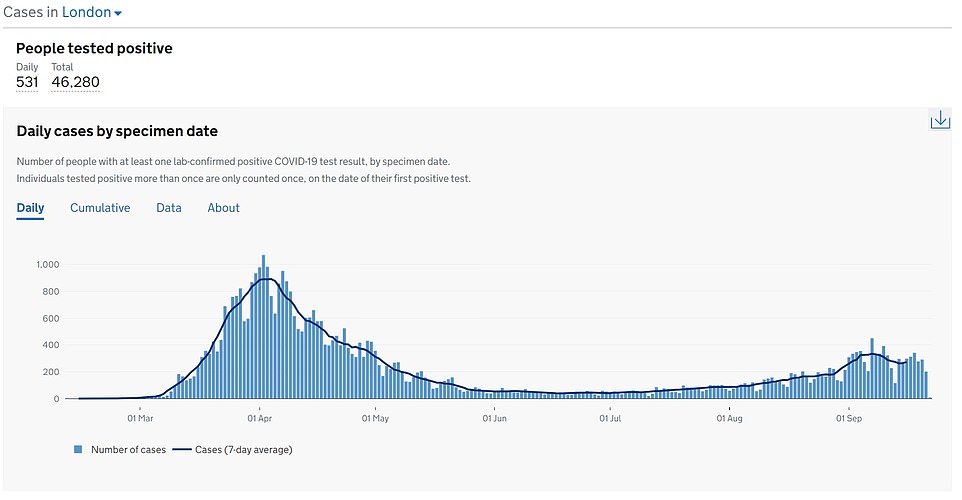
London is thought to be on the brink of a localised lockdown after public health chiefs warned of a ‘rising tide’ of the virus in the capital. More than 500 people are being diagnosed in London every day, more than double the number in August
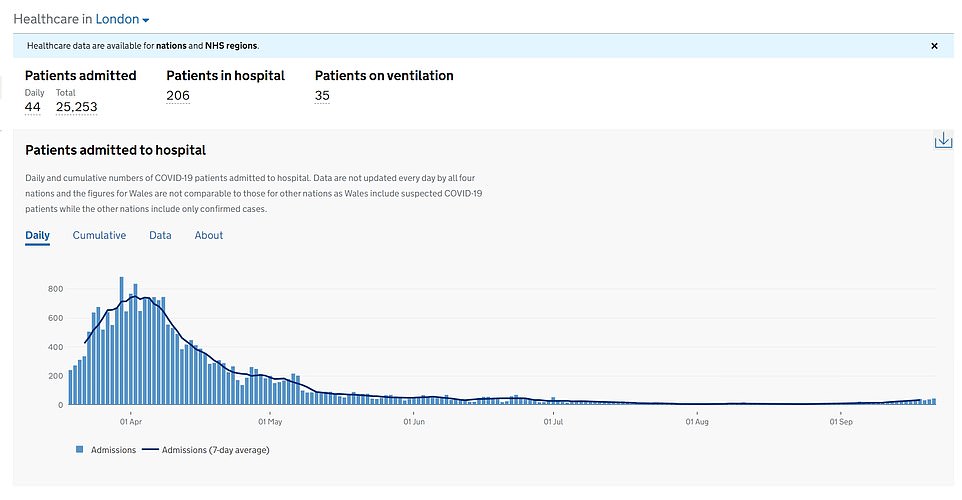
Covid-19 hospital admissions in the capital have tripled in a fortnight, with the seven-day average rising from 11 on September 2 to 33.4 by September 18. But the number of hospitalisations in the city is still a far cry from the 700-plus at the height of the pandemic in spring and only slightly higher than they were the start of July (around 25), when the country was deemed safe to reopen again
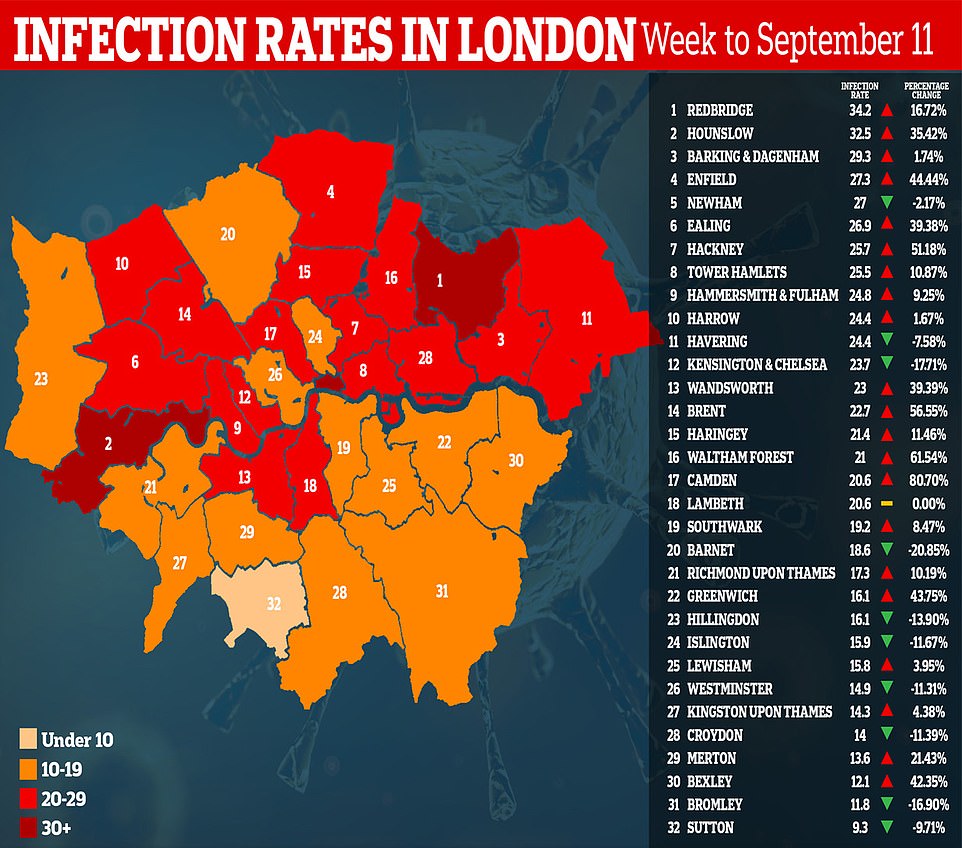
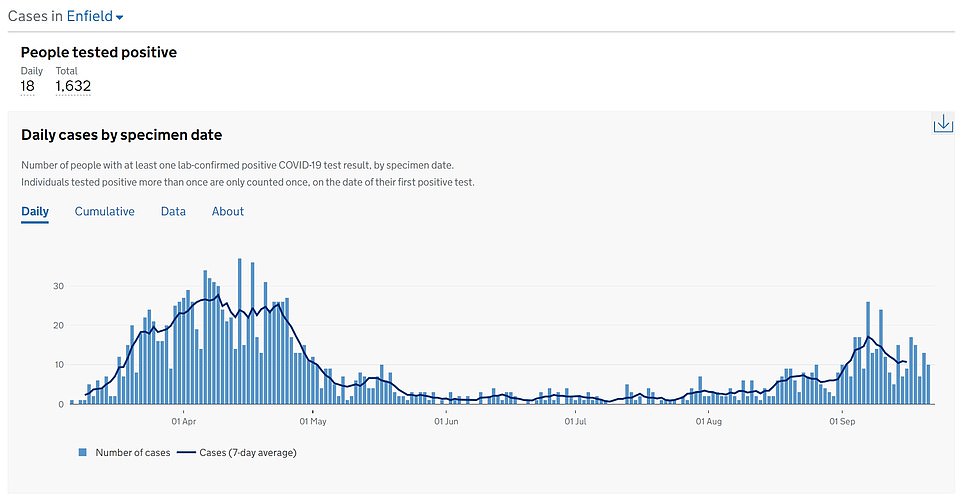
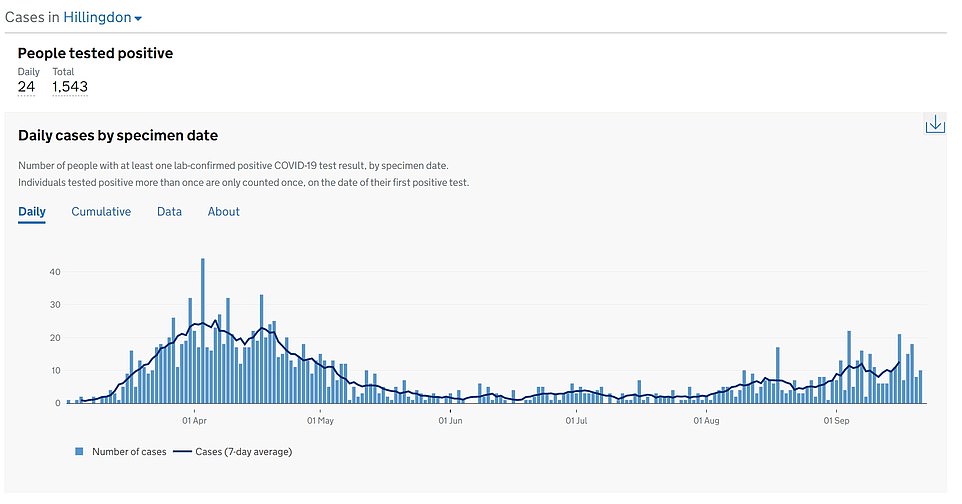
Public Health England data shows only a handful of London’s 32 boroughs are now seeing a sustained rise in infections – including Redbridge, Hounslow, Barking and Dagenham and Enfield
Redbridge, in east London, is suffering the highest number of infections of anywhere in the capital, with a weekly case rate of 34.2 per 100,000 people, according to PHE data up to September 18. The borough of 300,000 people currently has just the 40th highest infection rate in the UK but it has suffered a sustained increase in diagnoses of Covid-19 over the past month and a half.
Figures show infections have tripled in Redbridge since September 4, when the rate was 11.2 per 100,000 per week, and have risen by tenfold since the start of August (3.3).
And Redbridge’s actual number of new infections being diagnosed each day — figures which are provided by the Department of Health — is one of the only borough’s to still be on the up. It went from a rolling seven-day average of three cases at the end of August to almost 23 at the end of last week.
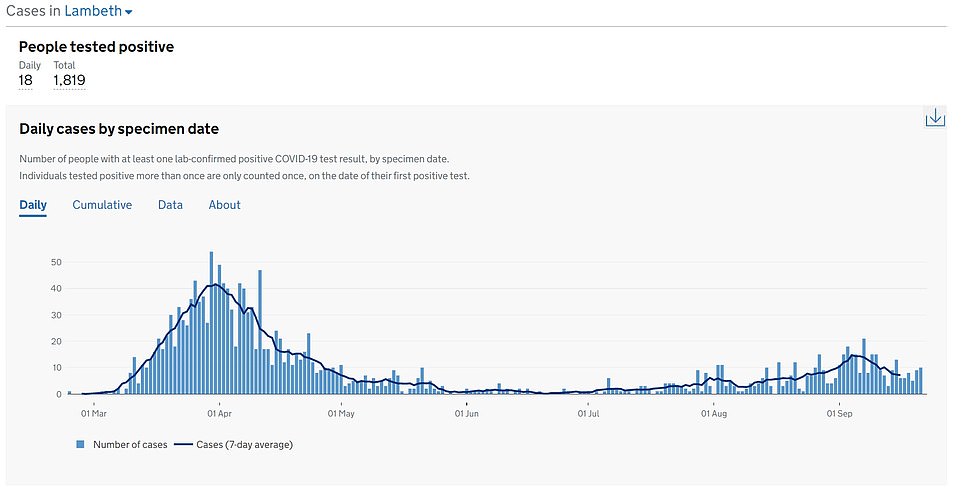
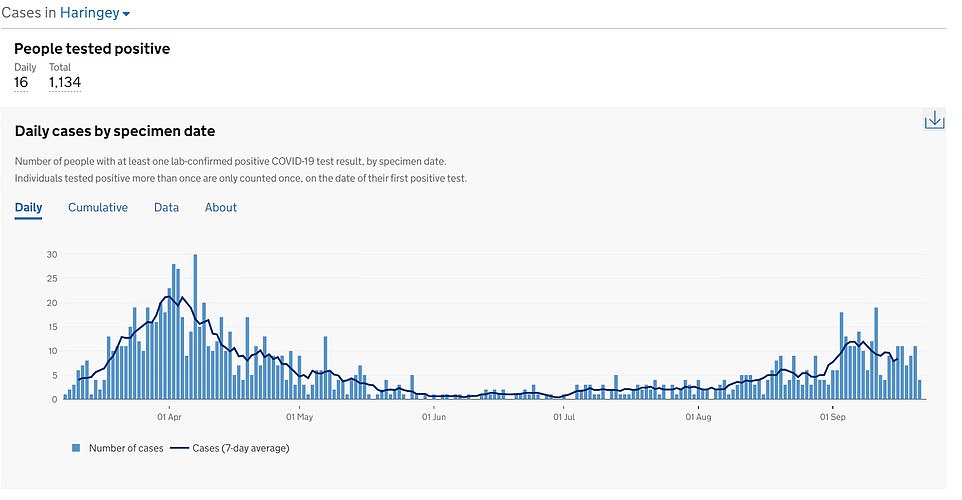
The Department of Health data, published on the government’s coronavirus dashboard, takes into account daily cases by specimen date, meaning they lag behind by a few days because it can take upwards of 72 hours to get a result back.
The west London borough of Hounslow has been the second worst-hit region in the capital, with a weekly case rate of 32.5 per 100,000 in the week ending September 18. Like Redbridge, Hounslow has seen cases triple in the past three weeks after rising from 5.9 new infections per 100,000 people at the start of August.
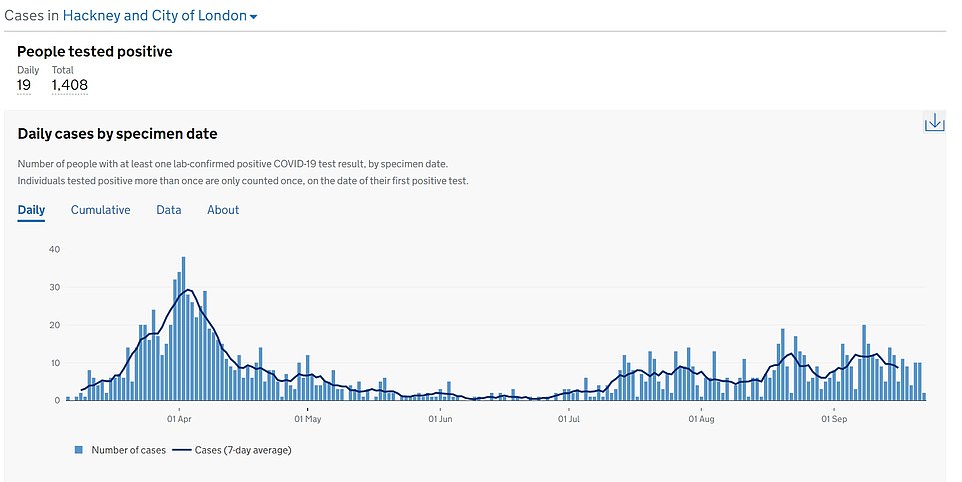
But Department of Health data shows cases in Hounslow, home to 290,000 people, have started to fall. Around 16 actual cases were being diagnosed each day on September 7, up from four at the end of August. But this dropped to below nine on the most recent full-day of data, September 16.
Hounslow has one of the largest South Asian populations in the country – about 20 per cent, compared to the 2 per cent national average – who have been disproportionately affected the virus throughout the crisis.
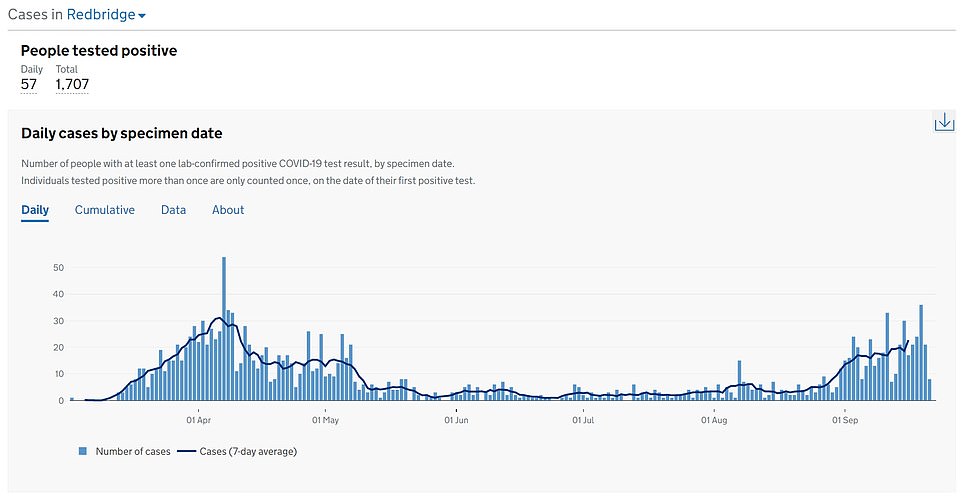
Figures show infections have tripled in Redbridge since September 4, when the rate was 11.2 per 100,000 per week, and have risen by tenfold since the start of August (3.3)
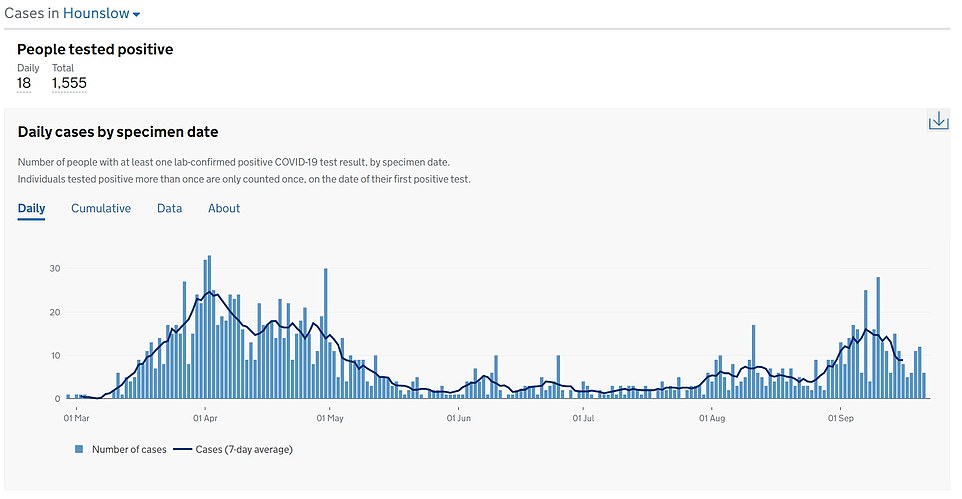
The west London borough of Hounslow has been the second worst-hit region in the capital, with a weekly case rate of 32.5 per 100,000 in the week ending September 18
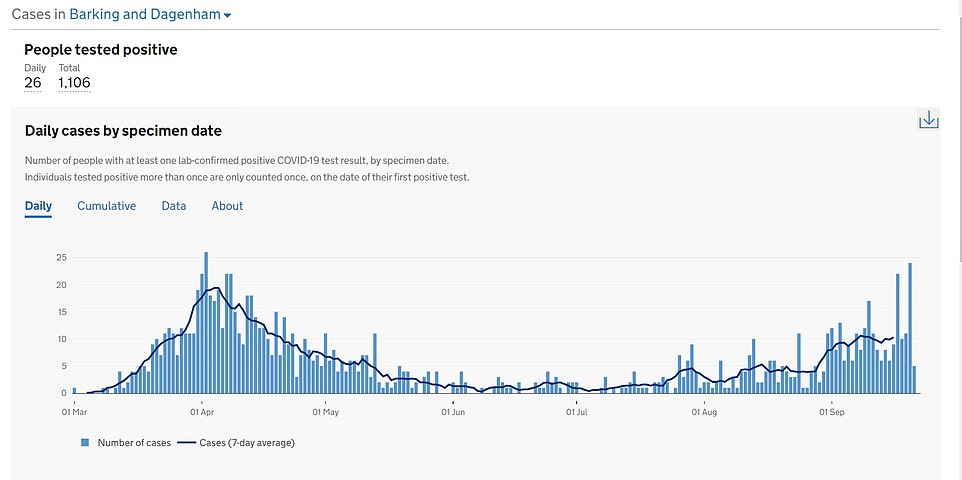
The east London borough of Barking and Dagenham is suffering 29.3 infections per 100,000, having more than doubled since the start of the month, when the case rate was 12.3 per 100,000, and quadrupling since August 1 (5.9 per 100,000)
The weekly infection rates in both boroughs are still significantly lower than the UK average, which is about 47 per 100,000. Although this figure is being skewed upwards due to outbreaks in the likes of Bolton, Blackburn and Oldham.
The east London borough of Barking and Dagenham is suffering 29.3 infections per 100,000, having more than doubled since the start of the month, when the case rate was 12.3 per 100,000, and quadrupling since August 1 (5.9 per 100,000).
Department of Health figures suggest its rolling seven-day average number of daily infections is also still on the up. The borough, home to around 210,000 people, recorded an average of four cases a day at the end of August. This jumped to around nine during the start of September before levelling off.
But figures for the past week, which are not yet deemed to be accurate because of the three-day lag it takes for coronavirus test samples to be analysed, suggest it may yet be hit by another spike.
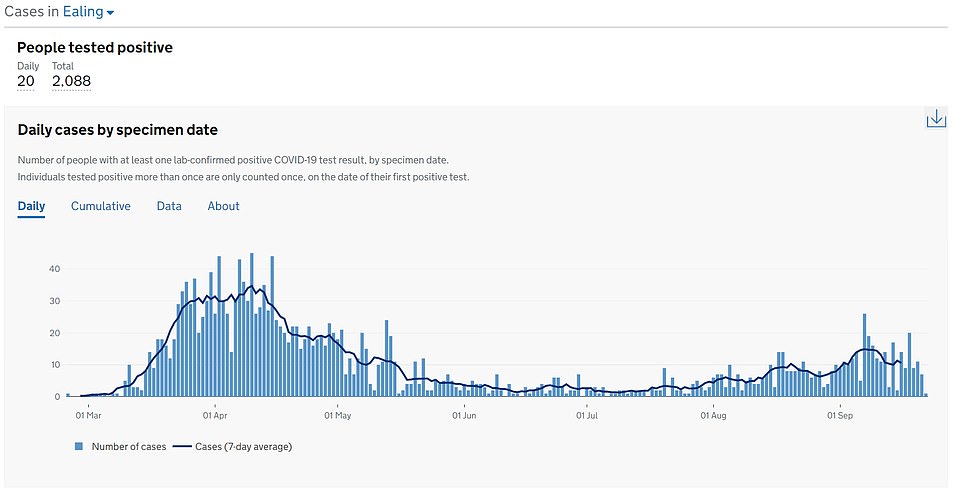
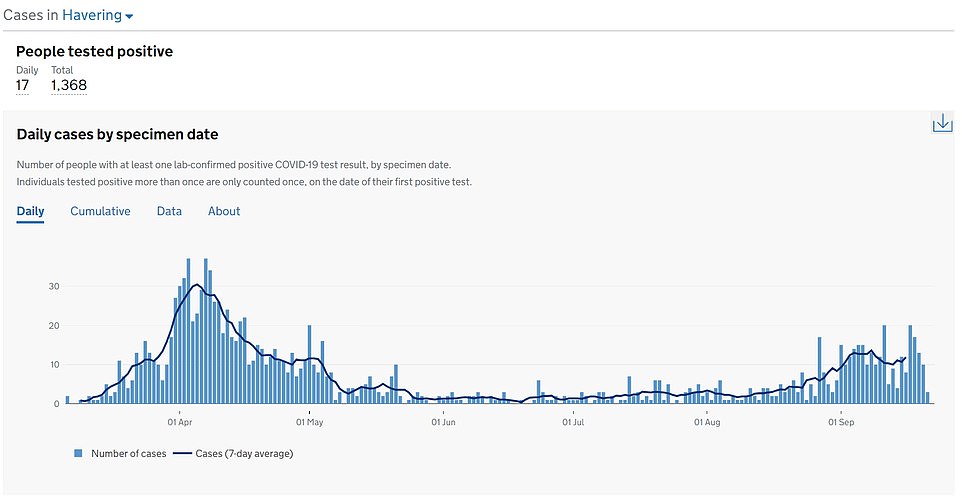
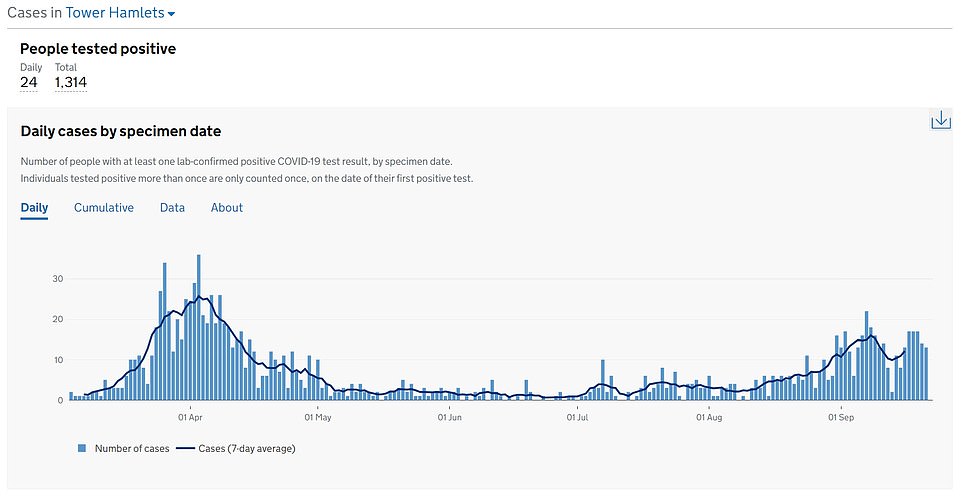
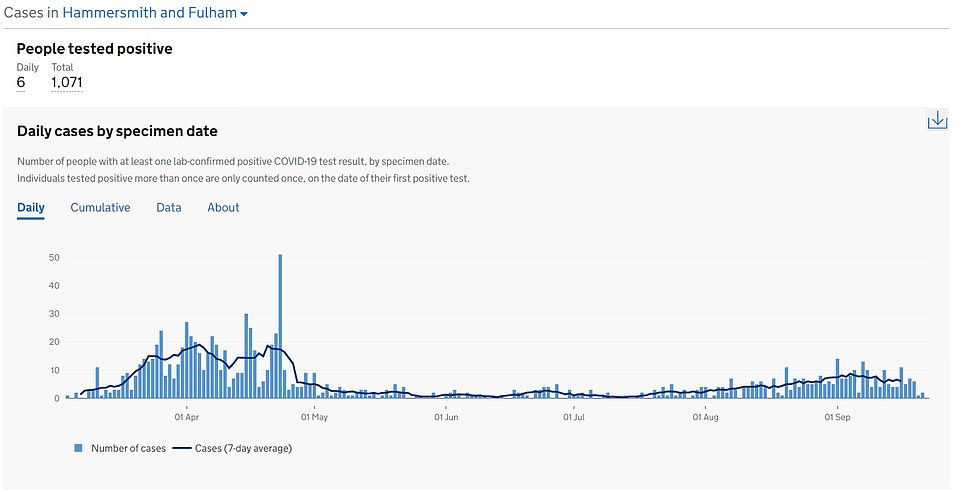
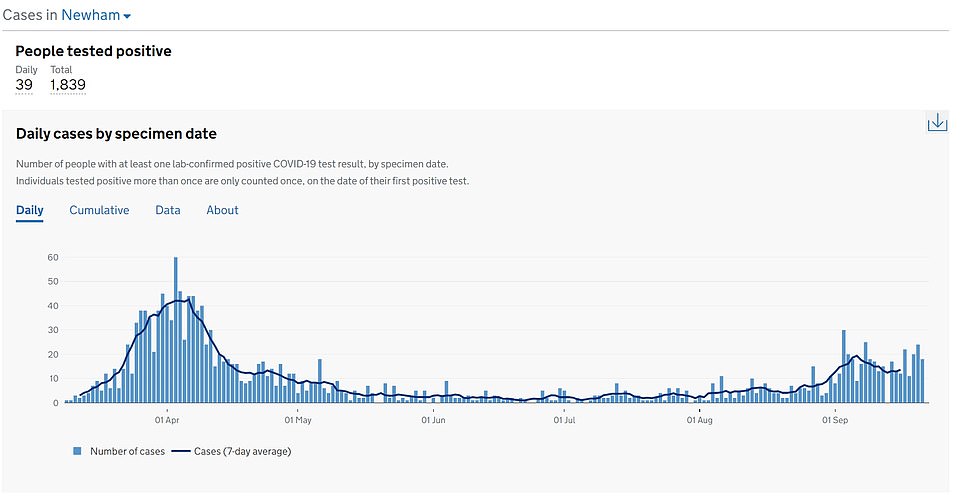
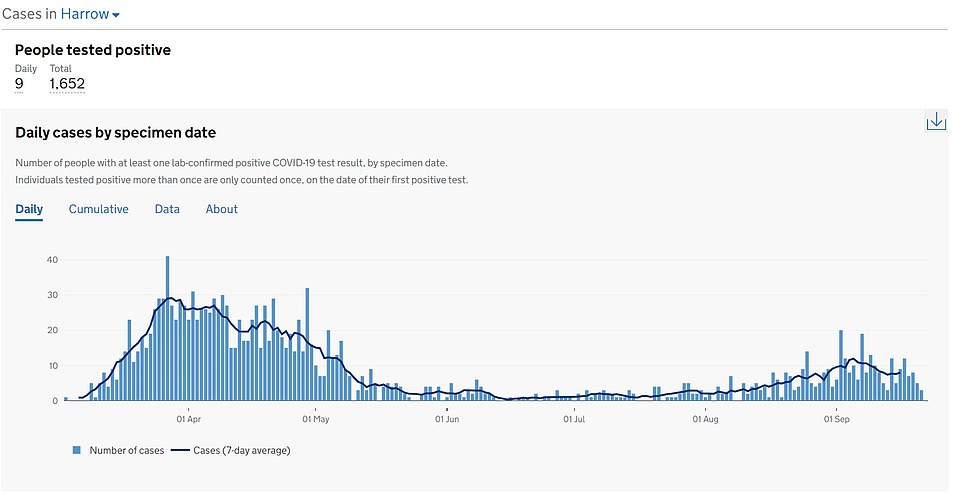
Rounding out the top 10 worst-hit boroughs in London for infection rates are Enfield (27.3), Newham (27), Ealing (26.9), Hackney (25.7), Tower Hamlets (25.5), Hammersmith and Fulham (24.8), Harrow (24.4) and Havering (24.4), all of which were up on the week before except Newham.
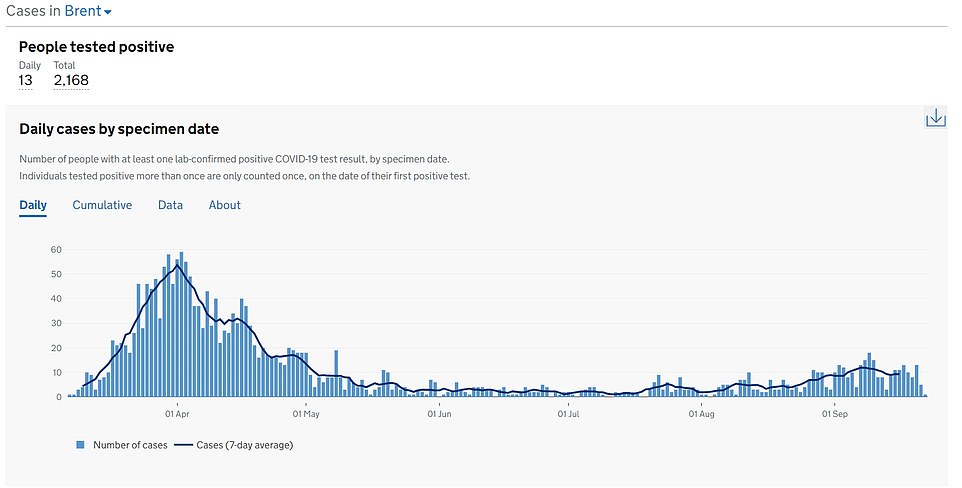
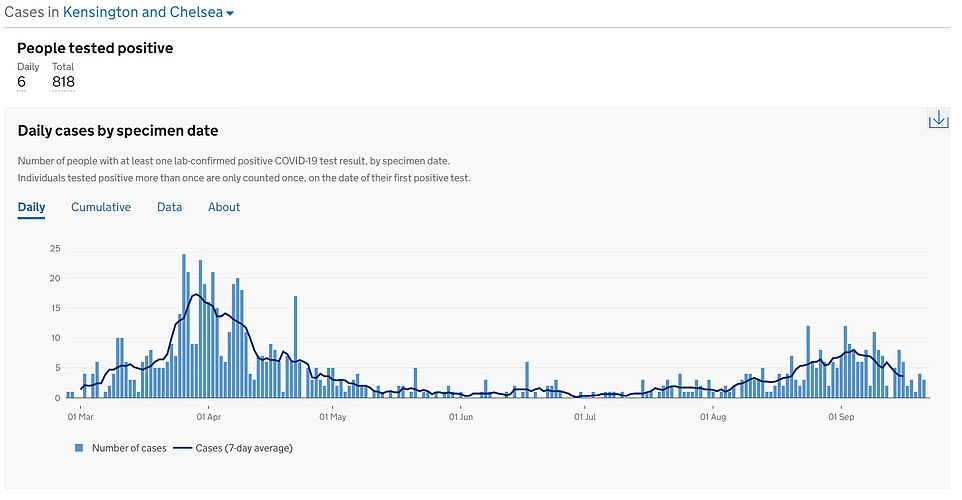
MailOnline analysis this week revealed that 20 boroughs in total across London have infection rates higher than areas of England already hit by restrictions, including Kensington and Chelsea (23.7), Wandsworth (23), Brent 22.7.
Public Health England’s most recent watchlist shows the authority in England with the lowest case rate considered an ‘area of intervention’ — the highest degree of concern — is Ribble Valley, with 18.3 cases per 100,000.
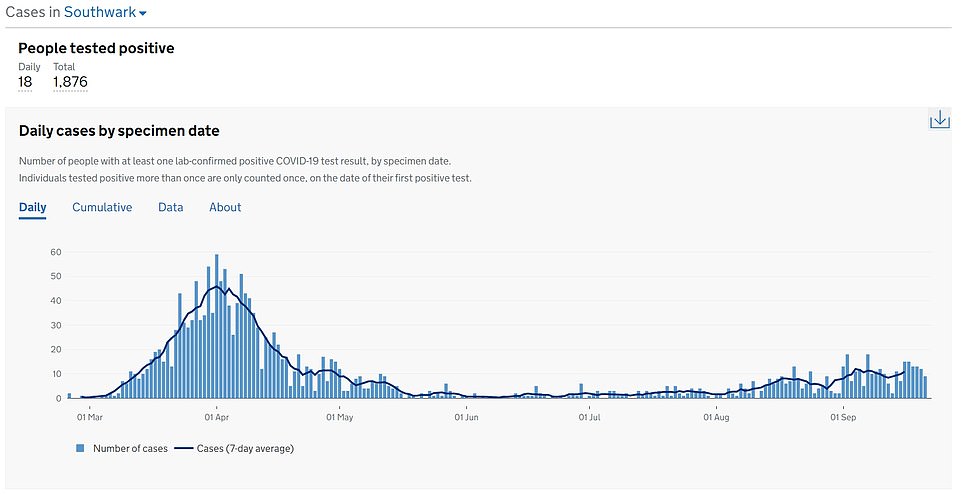
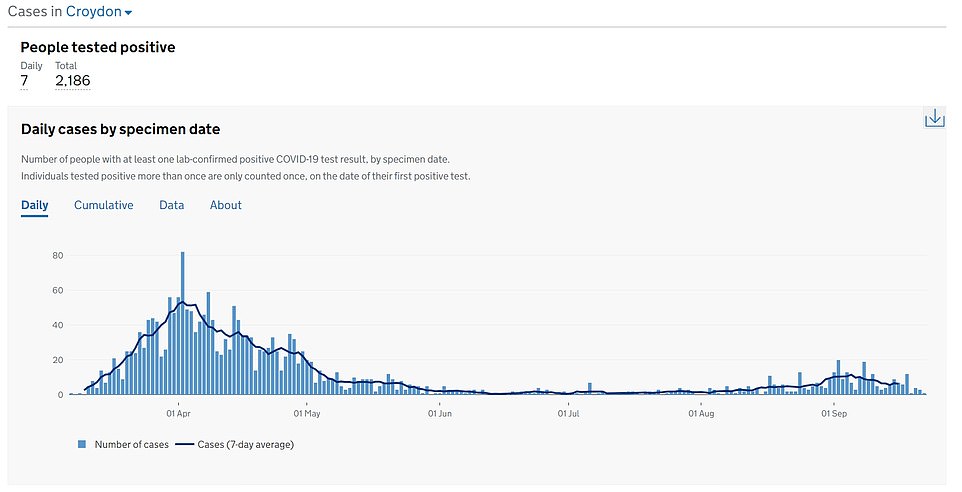
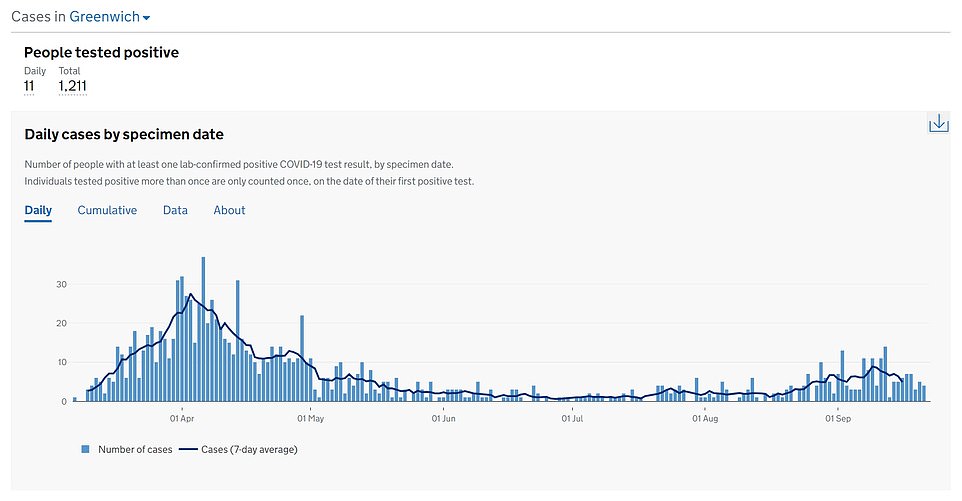
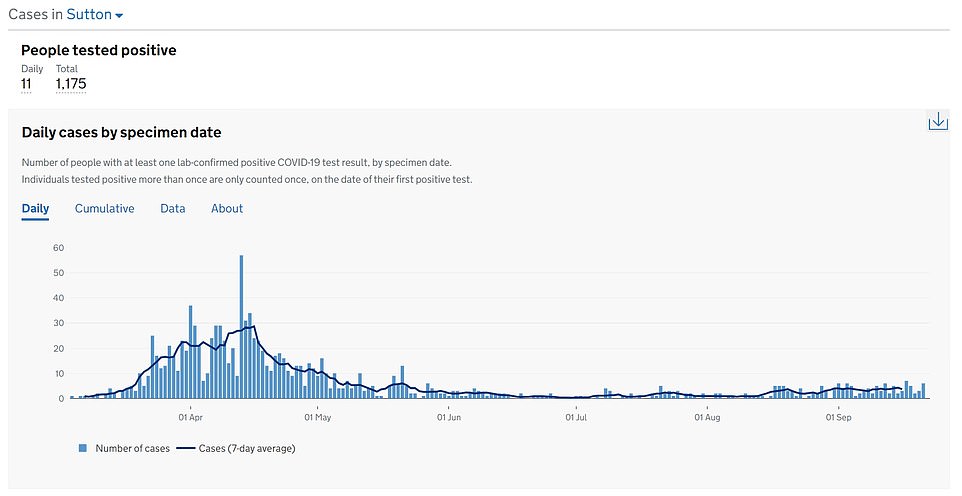
Meanwhile, several boroughs in the capital have managed to keep virus cases suppressed since August, despite the upwards trend seen across the nation.
The south London borough of Sutton ranks among the 25 least affected areas in England, with a current weekly case rate of 9.3 per 100,000, according to PHE data up to September 18.
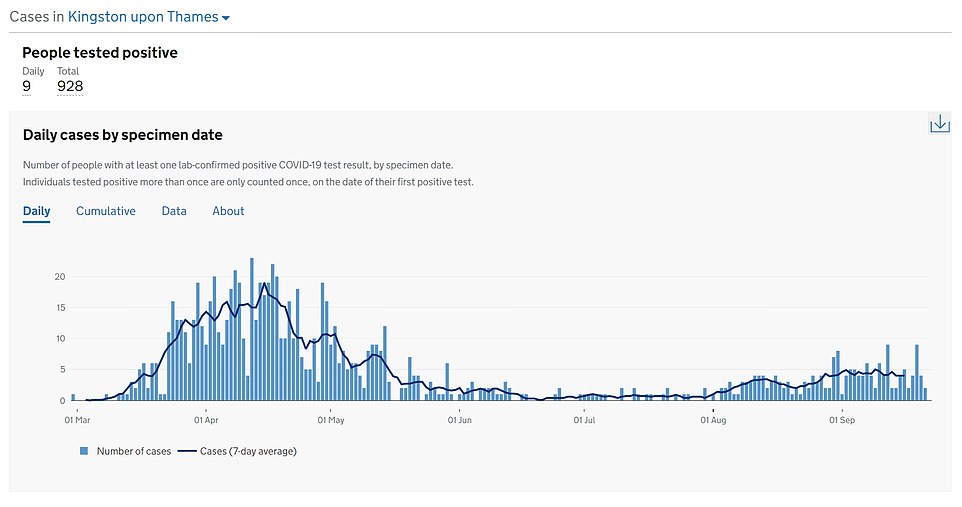
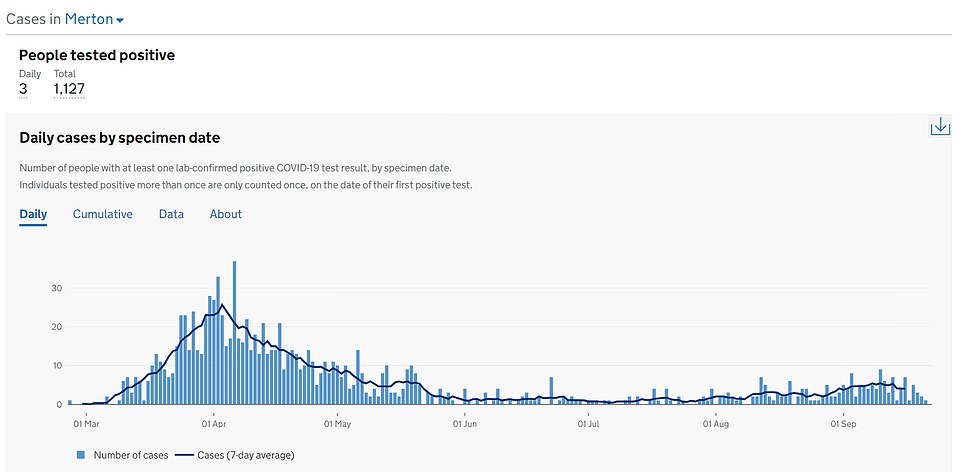
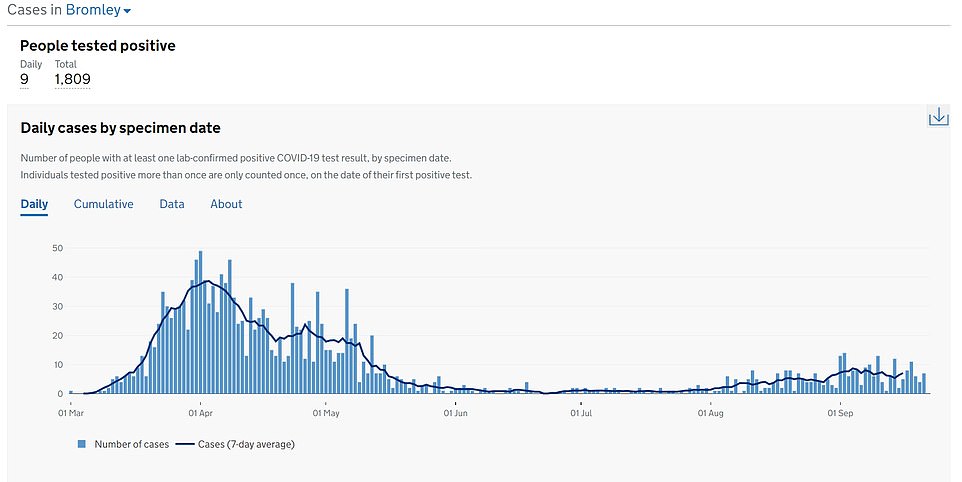
This actually fell from the previous week (10.3) and has just by just 45 per cent from the start of August (6.4). Bromley (11.8), Bexley (12.1), Merton (13.6), Croydon (14) and Kingston upon Thames (14.3) have the five lowest weekly infection rates after Sutton.
All of those boroughs, excluding Merton, do not have an underground station, which may partly explain the low number of cases. British scientists have previously linked busy tube stations to worse flu outbreaks.
Professor Fenton has warned cases could be being massively under-reported due to Londoners struggling to get access to tests. He said that increased hospital admissions and a rising number of calls to 111 were better indicators that London was in the midst of an outbreak as serious as in the northeast.
Professor Fenton revealed that about that about a fifth of testing capacity had been stripped from the capital and reallocated to hotspots in the north this month. In the middle of August there were about 90,000 tests being done every week in London, but by last week there were just 65,000.
Testing bosses say they’ve had to prioritise resources at a time when the country is struggling to ramp up capacity fast enough to deal with the looming second wave.
Boris Johnson has pledged for the UK to be able to process 500,000 coronavirus tests a day by the end of next month, more than double the current 242,000 capacity. But industry insiders say this target could be missed because of delays in machines and chemicals.
Professor Fenton told The Times: ‘We are seeing a rising tide of coronavirus cases in London across a broad range of ages. This is no longer limited to young people in their twenties.’
He said that ‘whilst the number of cases by borough varies, the general trend across the city is one of steadily increasing transmission and if that continues then the situation may escalate’.


[ad_2]
Source link
