Page speed : What is page speed ? how to optimize, Tools and a complete guide
Page Speed
There are lots of tools to test page speed, and lots of different metrics to target. But do you understand how those optimizations work, or whether they’re actually going to make your website faster?
Page speed is a complex topic. Many of the existing articles give you a list of actions to take or plugins to install to help with different aspects of speed. That’s fine, but not all sites are the same. So, in this post, I’ll help you understand how page speed works, and what actions to take for your particular site.
With that said, if you are not technical and you’re just hoping to install a plugin/module to speed up your site, here are some that should help:
WordPress:
- WP Rocket (paid) + an image optimization plugin, or:
- Autoptimize + a cache plugin
Drupal
Now, back to business. Here’s everything going to be covered:
- What is Page Speed?
- Why You Should Care About Page Speed
- How Fast Should My Page Load?
- How A Page Is Built
- Page Speed Testing And Tools
- Estimating Impact of Changes
What is Page Speed?
Page speed is the amount of time it takes for a web page to load. It is difficult to assign a single number to page speed because many metrics capture elements of the page load in different ways, for different purposes, and with different test conditions.
Also Read :Complete SEO checklist And How to install google analytics
Why You Should Care About Page Speed
There’s been a renewed focus on page speed from Google recently with mobile speed becoming a ranking factor, a Speed Report in Google Search Console, and Chrome announcing they may flag sites that are slow, but did you know that page speed has been a ranking factor for Google since 2010?
Here are the reasons you should care:
- Impacts User Experience. You want visitors to have a fast and smooth experience. Any delay or lag on their actions is noticeable.
- Impacts Analytics. Generally speaking, a faster site will record more visitors because the analytics tag will load sooner. If a person leaves before the tag is fired, they won’t be recorded in the analytics system.
- SEO? The Speed Update only impacts the slowest sites according to the official announcement.
There are lots of studies showing that if you increase page speed, you’ll see increases in things like organic traffic, click to visit ratio on ads, more visitors in general, and many other benefits. WPO Stats has many example studies on page speed improvements.
However, I will caution that many of these studies may be a bit misleading. Unless you were extremely slow before, Google says that improving page speed should not impact your rankings.
So why might you see more visitors?
The answer is that the analytics tag probably fired sooner than before, and was able to record more people before they leave a page.
“Page Speed” isn’t as straightforward as it sounds.
That’s because there are lots of different ways of measuring page speed. Here are three of the most common:
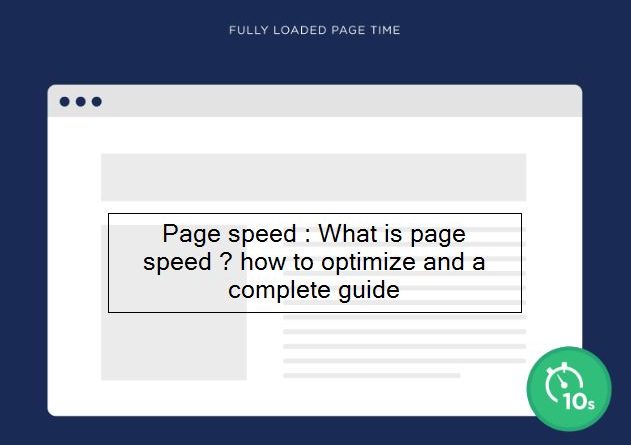
Fully Loaded Page: This is how long it takes for 100% of the resources on a page to load. This is the most straightforward way to determine how fast a page loads.
Time to First Byte: This measures how long it takes for a page to start the loading process.

If you’ve ever landed on a page and stared at a white screen for a few seconds, that’s TTFB at work.
First Meaningful Paint/First Contextual Paint: This is the time it takes for the load to load enough of its resources to actually read the content on your page.
For example, let’s say you have a blog post that takes 10 seconds to fully load.

That’s a long time… if you ONLY look at how long it takes for the entire page to load.
On the other hand, paying attention to First Meaningful Paint sometimes better represents how users actually interact with your page as it loads.
For example, let’s look again at the page that takes 10 seconds to load all of the page’s resources.
Even though it takes a while for the entire page to load, when a user first lands on the page, they get a “First Meaningful Paint” after 1.5 seconds.

Which means they can start interacting with your page pretty much instantly. So to a user, your page is fast.
[amazon box=”B084LF85PC” “small”]
Bottom Line?
There are lots of different ways of measuring page speed. And there’s no “right” metric that beats all of the others. They all have pros and cons.
Instead, focus on improving your page loading speed for ALL of the metrics that you find.
Why Is Page Speed Important for SEO?
Google has used page speed as a ranking factor since 2010.

And in 2018 Google ramped up the importance of page speed with The “Speed” update.

In short:
A slow loading website can hurt your Google rankings.
The question is: how does Google determine your site’s loading speed? Do they look at how long it takes for 100% of the page to load? Or TTFB?
They haven’t made any official statements on it. But considering that they report on all of these metrics in their PageSpeed Insights tool tells me that they probably use a combination of different page speed measurements:

With that, here’s how to improve your site’s loading speed.
Best Practices
Compress Images
I put this first because it’s usually the biggest win.
After all, images usually take up 50-90% of a page’s size.

(And loading speed)
For example, look at this page speed report from a page on my site:

As you can see 86.2% of the page size is due to images:

So the more that you can compress your images, the faster your page will load.
How?
If your site runs on WordPress, then I highly recommend a plugin called WP Smush:

It automatically compresses any image that you upload to the WordPress media library. And at least according to the creators of the plugin, this can reduce your image file size by 14.2%.
Not using WordPress? There are still plenty of image compression options out there, like Caesium and the Mass Image Compressor.
Unlike back in the day, most of the compression tools now either use lossless compression or only reduce image quality to a point that’s barely noticeable.
For example, we compress 100% of the images here at Backlinko. And they still look nice and sharp:

Clean and Compress Your Code
In other words: minify the resources found on your page.
This includes:
- HTML
- CSS
- JavaScript
- And any other code found on your page
Your first step should be to clean up any bloated code that you have on your page. This extra code could be from features that you don’t have on your site anymore. Or from shoddy developer work.
Either way: the cleaner your code, the faster things will load.
(Yes, that rhymes 🙂 )
Then, compress your code using a program like GZip.
Upgrade Hosting
This is one tip that I don’t see enough people talking about.
You can clean up your code and compress image all day long. But if you spend $4.99/month on hosting, your site isn’t going to load quickly.
That’s because you’re sharing a server with a million other websites.
There are a million web hosts out there. So I can’t recommend one in particular.
But I can say that as a general rule: when it comes to hosting, you get what you pay for.
So if you’re serious about improving your site’s loading speed, it might be time to upgrade to a premium host or to a dedicated server.
[amazon box=”B07DQTFX6F” “small”]
Activate Browser Caching
This allows users to store parts of your page in their browser cache.

So the next time they visit your site, it loads MUCH faster.

Unfortunately, this won’t help your page load any faster for first-time visitors. But it’s great for improving your loading speed for people that have visited your site before.
You can set up browser caching in your .htaccess file. Or with a WordPress plugin.
Implement a CDN
A Content Delivery Network (CDN) is one of the easiest ways to boost your site’s loading speed.
CDNs work by figuring out where your visitor is physically located… and then serving up your site’s resources from a server close to them.

Test With Multiple Page Speed Testing Tools
Now that you’ve implemented these steps, it’s time to see how you’re doing.
And I recommend testing your page speed using two different tools.
The first is Google PageSpeed Insights.

Google’s tool scans your page’s code for problems…

… and opportunities.

And they recently added a feature that reports on how long it takes for your site to load to actual human users (using Google Chrome Browser data).

Which is SUPER useful.
One word of warning: you’ll sometimes find that the tool’s recommendations don’t make sense for your site.
For example, Google’s tool recommended that I “Serve images in next-gen formats”.

However, these “next-gen” formats aren’t supported by most browsers (including Safari and Firefox). So if you switch over to these next-gen formats, your site’s user experience is going to go down the drain.
That said: there are a ton of helpful insights in this tool. And I recommend implementing as many as you can.
Next up, we have WebPageTest.org.

What’s cool about WebPageTest is that it loads your page in an actual browser. And it lets you know about specific parts of your page that take a long time to load.

How Fast Should My Page Load?
There’s no official threshold. One of the common recommendations is that your site should load in less than three seconds. That likely comes from a Google study saying that 53% of mobile visitors leave a page that takes longer than three seconds to load.
This recommendation is also most likely based on the Speed Index metric, which we’ll talk about later, but that’s just my speculation based on what was a popular measure at the time of the study. I don’t believe that Google has ever mentioned a particular metric when giving a number for page speed. Usually, the recommendations from Google representatives are generic like “make sites fast for users” or “make sites as fast as possible.”
How A Page Is Built
To understand how to improve your page speed, you need to know how a browser constructs a page. For this, we’re mainly going to be looking at Waterfall charts to see what resources are loading. You can also see this in your browser by using “right-click” > Inspect > and bringing up the Network tab when loading a page.SIDENOTE. I’m going to be using https://www.webpagetest.org/ for a lot of the images, and I’ll link to the tests and list the settings where applicable.
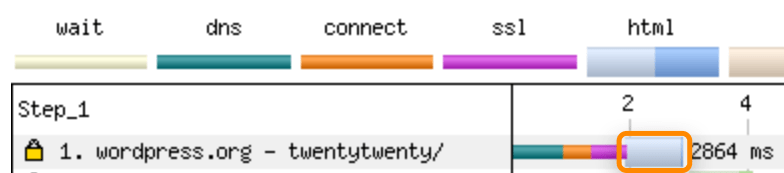
Establishing Connections
The green, orange, and purple below represent the time it takes to establish a connection to the website. I’ll go over each color below and what it represents.
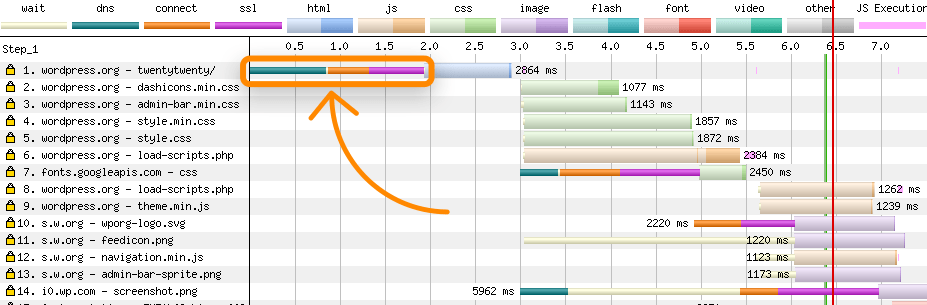
Waterfall chart for the TwentyTwenty WordPress theme page from WebPageTest.org Location: Dulles, VA. Device: Moto G4. Browser: Chrome. Speed: 3GSlow.
DNS (Green)
Domain Name System (DNS) is considered the phone book of the web. You give your browser a website name, and it checks with a DNS server to get an IP address (a location label) telling it where the website is hosted. It’s just like storing a contact on your phone so you only have to know the name and not the phone number.
Most of the time, your DNS is going to be with your domain registrar (where you bought the domain) or with your Content Delivery Network (CDN).
Importantly, not all DNS providers are created equal. If every millisecond matters to you, you might want to consider using a different DNS provider. According to DNSPerf, Cloudflare has an average query speed of 12.6 ms, whereas others like GoDaddy (46.04 ms) and Rackspace (90.38 ms) are slower on average. However, these numbers are not a completely accurate representation as the DNS can be cached (stored temporarily) in the browser when you’ve already visited a website. The amount of time it’s cached is referred to as the TTL (Time to Live). While the cache is still active, the browser won’t have to connect to the DNS server to know where to go to access the website.
Connect (Orange)
This is where the browser is establishing a connection with the hosting server. Transmission Control Protocol / Internet Protocol (TCP/IP) is complicated, but just think about how you get to work. It’s likely not a straight line; you have to make turns, and there will be areas with higher traffic. You may even re-route or make some wrong turns. That’s sort of how this works; it’s routing from your browser to the server and back.
If the time to connect is long, it could be one of many issues. On unstable connections, packet loss might occur and will have to be re-sent. This is akin to missing your turn on a roundabout and having to go around again. The problem could also be with the routing of the request through the network. How many hops it has to take, how far it has to go, how much other traffic is on the network are similar to how many turns you need to take, how far from work you are, and how many other cars are on the road that might slow you down. There’s also rate-limiting and connection capacity on the server, which would be similar to a tunnel that only allows so many cars though it at a time.
A lot of these issues are solved by making the distance to the server shorter and using more intelligent routing—which many CDNs can do. With a network of servers around the world, visitors can usually connect to a close one. Some CDN providers also manage large amounts of internet requests and can see in real-time where there may be bottlenecks (traffic). If they see a faster option, they can reroute the traffic—just like how a GPS would reroute you around a traffic jam.
Secure Sockets Layer (SSL) (Purple)
For sites establishing a secure connection (HTTPS), this is where the browser and server are agreeing on the TLS (Transport Layer Security) protocol version, the ciphersuite (level of security), and verifying the certificate (to make sure the site is the one it says it is).
You might be thinking that you can make your website faster by just not using HTTPS. That’s partially true—at least for the connection part. But there are other benefits to being on HTTPS like the fact that browsers don’t let you use HTTP/2 (H2) without HTTPS. H2 has some advantages like persistent connections, so it doesn’t have to keep opening a new connection for files on the same server. The headers within those requests are also smaller than in HTTP/1.1, and multiple files can be transferred simultaneously. In most cases, sites using HTTPS and H2 will be faster than sites on HTTP.
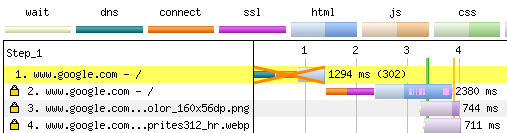
Generally, the most significant gains you’ll get here come from upgrading your protocol (TLS 1.3 is faster than TLS 1.2, for instance) and implementing HTTP Strict Transport Security (HSTS), which tells the browser always to use a secure connection. The browser changes the requests from HTTP to HTTPS without having to contact the server and do a redirect. In the image below, the redirect from HTTP to HTTPS and the time that took would be eliminated by using HSTS.
You may even want to look into using HTTP/3 for even faster connections. However, support for this protocol is still in the early stages, and—at least at the time of writing—is probably not yet a viable option.IMPORTANT: DEVICE, LOCATION, AND NETWORK MATTER
Consider this, connecting to a website on a mid-grade smartphone with a slow 3G connection takes ~2 seconds. On the same phone with an LTE connection, it’s cut down to ~0.41 seconds. On a desktop computer with normal speeds, it’s less than 0.1 seconds to make that connection.
Keep that in mind if you see longer connection times as it may be due to limited bandwidth or processing power of the test device. These factors—along with caching—are important. They can help you explain to someone who might pull out their latest smartphone, connected to WiFi, with all the files needed to load the page already cached on their device (we’ll talk about this in another section) that the way they are experiencing the site is under ideal conditions and not how most people will experience it.
Downloading And Processing HTML
The HTML code of a page is what is initially downloaded by a browser. This is the information you see when you right-click on a website and go to “View Page Source.” Once a connection has been established, and the browser gets the first bit of information back from the server, we reach the Time To First Byte (TTFB), which is the typical measure for the initial response time. As represented by the orange lines below, this is the time from the start of the HTML request (light blue) to the time when the HTML starts to download (dark blue).
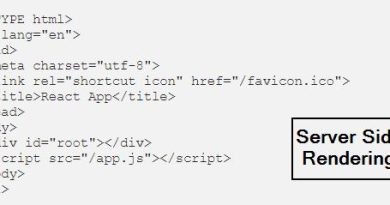
If there’s a delay for TTFB, it could be due to database queries, server resources, waiting for a Server Side Render (SSR) to complete, or other things typically involved with creating dynamic content. The download time will depend on things like the connection and file size.
This is also where the browser also starts to construct a page. When the HTML is downloaded, the browser parses it into the Document Object Model (DOM), which is how a computer understands the structure of the content. That parsing process uses the browser’s main thread to process user actions and paint the page, run JavaScript, and perform layouting, reflows, and garbage collection. For now, just know that this main thread exists and handles a lot of different tasks. We’ll cover this a bit more later.
If you see a gap between HTML and the next request, the most likely cause is that the CPU is busy processing the HTML to build the DOM. Since it’s the CPU, this is again dependent on the device being used, so you can test with a more powerful device to see if that gap still exists.
For the HTML and other file types like CSS and JavaScript, you can cut the time down by using less code, minification to remove unnecessary characters like comments and white space from the code, and compression to reduce the size of the files. The point is to make the file download smaller so this part of the load would be faster. However, there isn’t only one way to do minification and compression. In many instances, this is handled by the CDN or the server (Apache or Nginx are common servers), or by a plugin/module/package. You can find more information on implementing compression here
Handling Additional Connections
When the HTML has been downloaded, references to other files and other servers will be processed, and new connections will start. This is typically where other files like JavaScript, CSS, Images, and Fonts are added to the mix. Things can get crazy here as some files reference other files, and we start chaining connections and file downloads. Take a look at the Request Map below for Forbes.com. Each point is an individual file request, and each line is where one file is referencing another file that has to be downloaded. Overall it’s 363 requests across 128 connections.

Source: RequestMap
Use the Same Server for Requests When Possible
It used to be a best practice to host resources on cookieless domains that were not the same as the main domain, and sometimes there’d be a benefit to using multiple domains (a process called domain sharding) because of connection request limits set by the browser.
Since HTTP/2, that has not been a best practice. You should use the same server for requests, if possible.
For example, take cdn.ahrefs.com in the waterfall chart below.
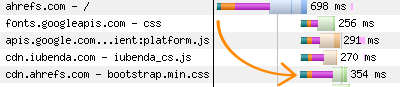
If that file were hosted on ahrefs.com, then it wouldn’t even have to make the connection. It’s being delayed by the time to make the DNS connection, to connect, and to negotiate the security handshake. Without the extra hoops to jump through, we would have the file earlier, which means the page would load even faster.
Also read : how to do Keyword research And ultimate guide to robots.txt
However, while self-hosting many files like fonts can lead to gains, there may be other trade-offs like caching (storing a copy of a file) where browsers may sometimes have common resources cached. For example, if I visited one website that called a font from Google Fonts and then went to another website using the same font, I might have that file cached locally already and not have to download it again.
[amazon box=”B08229JZSD” “small”]
Use Preconnect or DNS-Prefetch (If You Use Another Server)
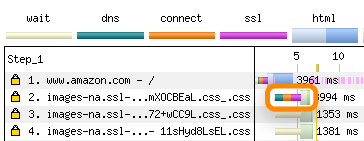
If you’re going to use a different server, Preconnect to servers that contain files needed early in the page load. This is going to make the connection to another server earlier than it would ordinarily happen. See below how one of the connections for Amazon starts before the HTML is even finished processing.
Code example:<link rel="preconnect" href="https://site.com">
There’s also DNS-prefetch if you just want to handle that part of the connection early. The green (DNS) part would connect early, but the rest of the connection will happen later. DNS-prefetch has better support than preconnect, but if you look at current usage statistics, the difference would be negligible. Preconnect is generally better if you know something from that server needs to be loaded early for the page to function. However, because preconnect requires more work for routing and security (the orange and purple), it’s also going to be a bit more resource-intensive early on.
Code example:<link rel="dns-prefetch" href="//asset1.com">
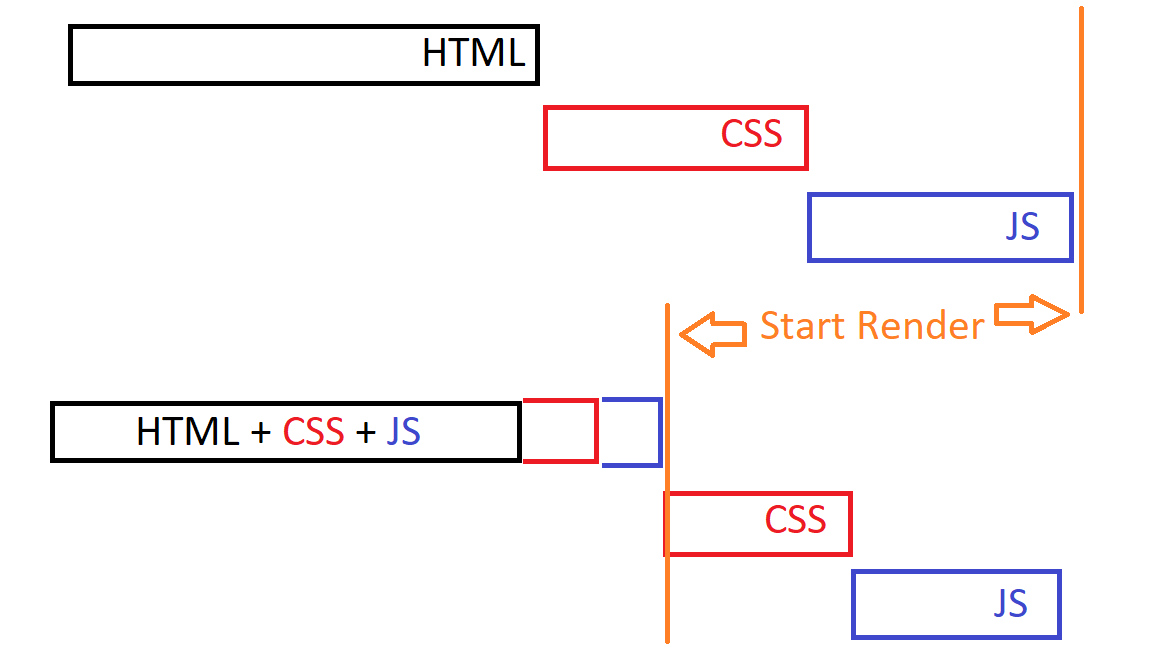
How Browsers Render A Page
Before we continue and discuss options for optimization, I think it’s best to understand a bit about how a browser renders a page. We have other files coming in now like CSS, JavaScript, Images, and Fonts, and the browser has to turn them, along with the HTML, into something useful. This is a dynamic process with new files being introduced, downloaded, parsed, and things being rearranged constantly to build the page. This process is commonly called the Critical Rendering Path and it looks like this:
- HTML is processed into the DOM tree we mentioned earlier
- CSS is parsed into the CSS Object Model (CSSOM), which tells the browser how everything is styled, padded, colored, sized, etc.
- The CSSOM + DOM together make what is called the Render Tree.
- Layouting happens, which is processing where each element will be within the browser viewport based on what’s in the Render Tree.
- Pixels get painted on the screen so instead of a white screen, you see colors, shapes, text, and images.
SIDENOTE. A fun fact revealed by Martin Splitt of Google is that Googlebot saves time and resources by not actually painting the pixels of a page. They have the information they need after layouting.
The goal should be to get the required elements as early as possible to build the initial view as fast as we can. The visible load time is people’s perceived view of a page’s speed, i.e., how soon the content appears on the screen for them. What impacts this the most is how resources are loaded. It’s usually the responsibility of the CMS or JavaScript Framework to help the browser prioritize when/what/how resources to load in what order to make the site appear faster. More on that in a bit.
You also want to keep things simple and avoid complex calculations and lots of changes during the layout phase. Google has a more developer-focused guide for that here, and another on simplifying the painting process.
Visual Load Metrics:
- First Paint (FP) — browser renders anything for the first time.
- First Contentful Paint (FCP) – browser renders something from the DOM (Document Object Model), which could be text, an image, etc.
- First Meaningful Paint (FMP) — most important elements visually loaded.
- Largest Contentful Paint (LCP) — largest element above the fold loaded.
- Visually Complete — page is visually loaded.
- Speed Index – a calculated score for the visual load that takes into account multiple points in time.
- Cumulative Layout Shift (CLS) — Measures how much elements move around in the viewport during the load, or how stable the layout is.
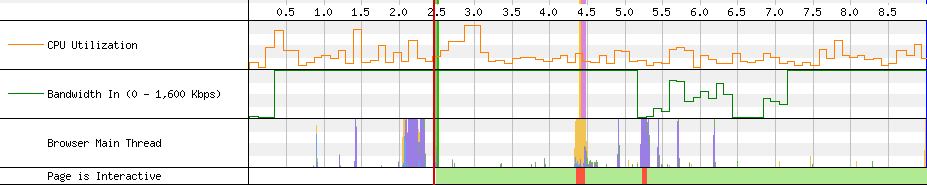
Seeing The Visual Load Along With The Waterfall Chart
On the Summary section in WebPageTest, if you enabled recording then you should have a Video column in the main table with “Filmstrip View.” In this view, the red line at the top with the visual snapshots is at the same point as the red line at the bottom in the waterfall.
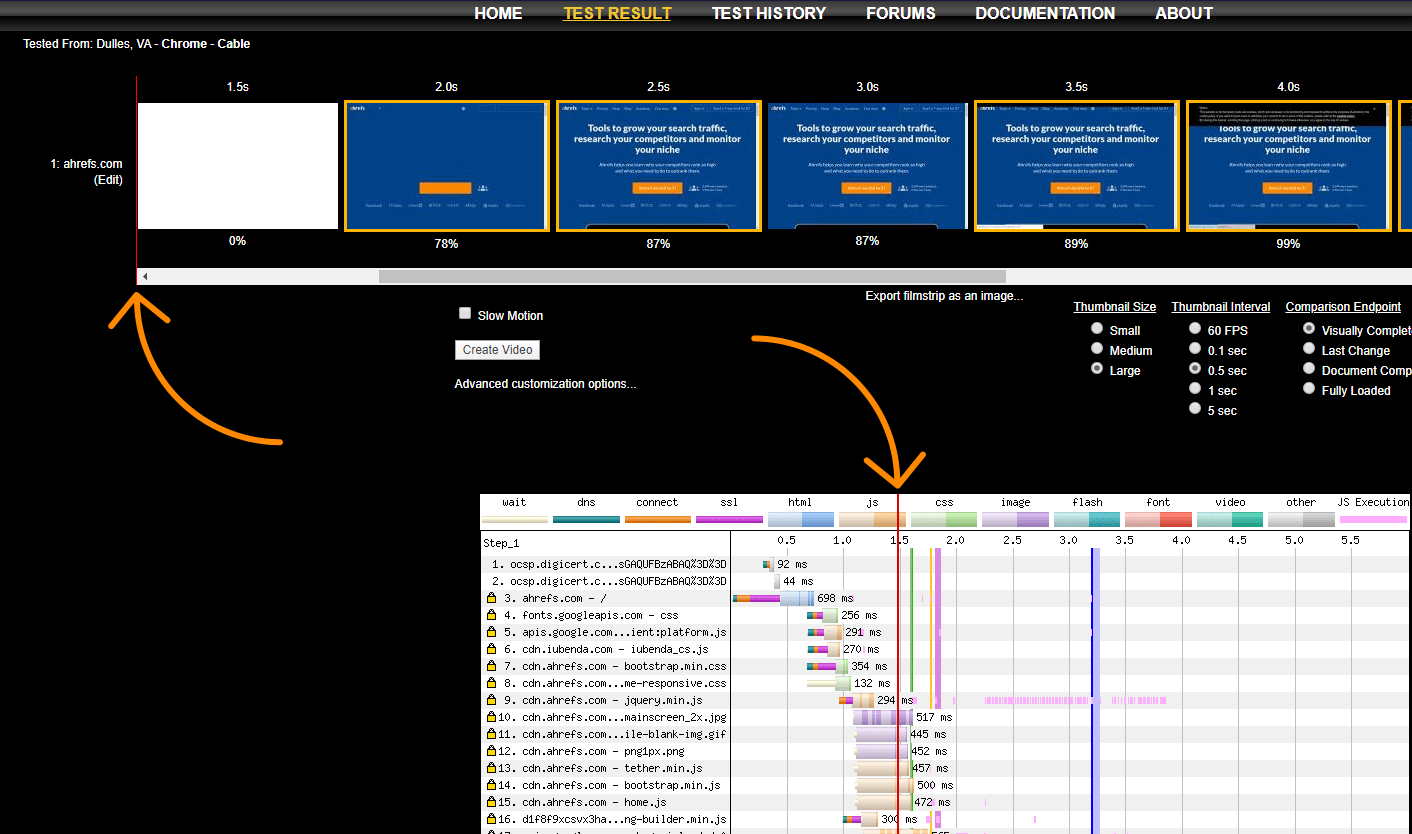
By moving the red line around to different points in the visual load, you should be able to look at what was just loaded in the waterfall that may have allowed different elements to display visually. This can help you determine what files you may need to prioritize.
For example, if you see that most of your page is loaded except the text, but right after that a font is loaded and the text appears, then that’s a good indication that font was required to show the text. You’ll also be able to tell what images may be needed earlier with different viewports by simply looking at the generated screenshots.
At the bottom of this chart is additional information such as CPU Utilization, Bandwidth, activity on the Browser Main Thread, and Interactivity. All of these charts again depend on the device and connection type. The information can be used to help troubleshoot different issues. For example, maybe there’s simply too much being downloaded, which keeps the Bandwidth at the highest point. Or maybe there’s a script using all of the CPU for a certain device, which can cause delays.
Filetype CSS
Where page speed gets complicated is that in many cases, there’s no one right way to do things. Most methods have tradeoffs, and some are more complex to implement and maintain. You have to decide what’s easiest, fastest, and best for you in your circumstances.
Looking at CSS files, they’re render-blocking by default, meaning that they need to be downloaded and processed before a page displays content to the user. If you cache (store a copy of the file, covered later in the article), then that file can be re-used for subsequent page loads. That means it won’t have to be downloaded again, and the next views should be faster.
Most of the speed tools test with the first view, so a lot of what you see in a tool like PageSpeed Insights is representative of a first time user who only views one page and not someone who visits multiple pages or comes back to your website often. Your goal should be to both optimize that first view and subsequent views for users.
Loading CSS Asynchronously
You want to load important code as soon as possible, and we’ll talk about a few options for that in a second, but the other part of this is you want the CSS not to block the render. To do this, we want to load the stylesheets needed later in the loading process as a different media type, which then gets applied to all types. It’s tricking the browser by abusing how they handle the loading of specific link element attributes. What it’s going to do is load the CSS without blocking rendering (because in this case, we’re telling the browser this stylesheet is for print and not really for this version of the page), and then apply to all media types (things that aren’t print) after it’s loaded.
For example, this:
<link rel="stylesheet" href="/my.css">
Becomes this:
<link rel="stylesheet" href="/my.css" media="print" onload="this.media='all'">
You can use this with all your CSS references. The tradeoff is that users may experience some flashing/re-styling as some page elements may be painted before the CSS is applied. So when the CSS is applied, the screen may change where and how things are displayed.
Inline
Inline takes code needed to render content above the fold and delivers it with the HTML response instead of a separate file. This is typically going to be the fastest way to shorten the time it takes to render the initial view.
The easiest way to think about this is you’re taking critical parts of the CSS and JS files and putting it directly into the HTML. The initial HTML takes a little longer to download and parse, but the render of the page can now happen before all the other files are even downloaded.
Inlining is probably going to get you the fastest render on the initial page load, but the tradeoff has traditionally been with caching. The code loaded in the HTML couldn’t be re-used from the cache, so you would typically be loading some of the code twice: once with the HTML and again in the normal file that was typically cached. But if you inlined code for every page, that also meant subsequent pages would have extra code as well. This is advanced and involves the use of service workers, but you can have both inlining and caching. Combined with making the rest of the CSS asynchronous as we mentioned above, this is pretty much an ideal state.
Remember that you can minify inline CSS code. As mentioned in the HTML section above, this removes some of the unnecessary spacing and extra characters to make the code smaller and faster to download.
You probably don’t want to inline all content from all the files. Be considerate and inline critical content only. You can technically inline all CSS and JS and even fonts and images, but you’re going to end up with a giant HTML download where a lot of the code isn’t used. That actually makes your website slower. If you have some smaller files of just a few KB and want to inline the whole thing for those, it’s probably fine to do so.
Inline Critical CSS at scale:
You’re going to want an automated system rather than doing this for every page. It might make sense to inline just the CSS for the homepage on WordPress themes since that typically has a different stylesheet than other pages. There’s usually going to be some plugin/module/package or a version of Critical or Critical CSS. These packages exist for any taskrunner or packaging you may be using like Grunt, Gulp, Webpack, or Framework like React, Angular, Vue, and you can even find tutorials specific to WordPress or Drupal or even hand-coded pages. They’re going to send a headless browser to the page to determine what CSS is actually critical for the page load at different sizes, and either give you the code or split the code into critical and non-critical elements so you can load them appropriately. A few examples:
Grunt:
https://github.com/filamentgroup/grunt-criticalcss
https://www.npmjs.com/package/grunt-critical-css
https://github.com/bezoerb/grunt-critical
Gulp:
https://github.com/addyosmani/critical
https://www.npmjs.com/package/gulp-critical-css
Webpack:
https://github.com/anthonygore/html-critical-webpack-plugin
https://github.com/GoogleChromeLabs/critters
https://github.com/anthonygore/html-critical-webpack-plugin
https://www.npmjs.com/package/critical-css-webpack-plugin
React:
https://www.npmjs.com/package/react-critical-css
https://github.com/addyosmani/critical-path-css-tools
https://github.com/sergei-zelinsky/react-critical-css
Angular:
https://github.com/addyosmani/critical-path-angular-demo
Vue:
https://github.com/anthonygore/vue-cli-plugin-critical
https://vuejsdevelopers.com/2017/07/24/critical-css-webpack/
Drupal:
https://www.fourkitchens.com/blog/article/use-gulp-automate-your-critical-path-css/
WordPress:
https://joe-watkins.io/javascript/inline-critical-css-with-wordpress/
https://wordpress.org/plugins/wp-criticalcss/
Hand-coded:
https://www.sitelocity.com/critical-path-css-generator
https://jonassebastianohlsson.com/criticalpathcssgenerator/
Preload
If you’re not going to inline the critical CSS, the next best option is arguably using Preload. Preload fetches requests earlier in the load, getting essential resources needed to display the page faster than usual. Preload sets the browser priority for preloaded assets as high and loads them asynchronously, so they don’t block rendering. It also works across domains.
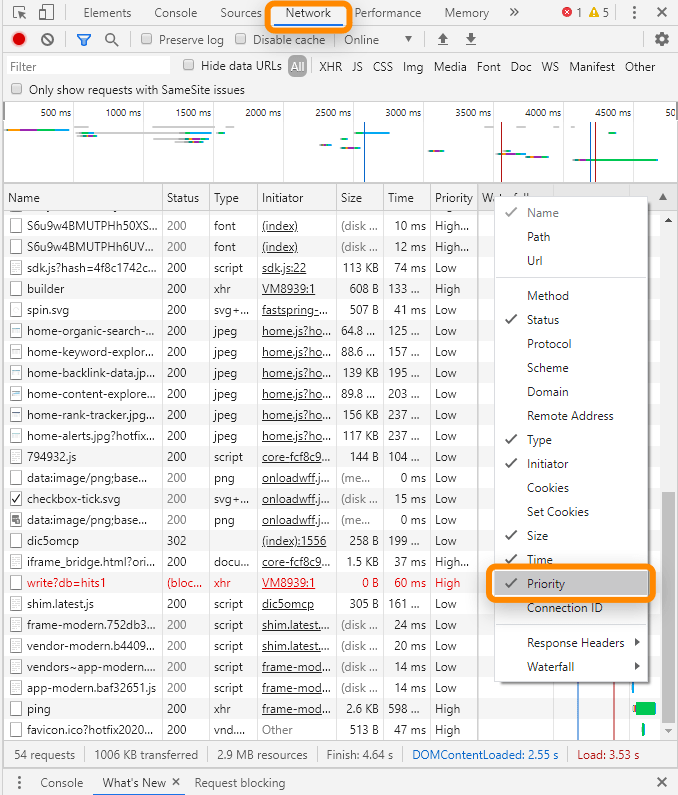
The browser gives each request for a file a priority. The idea is to get files needed to display above the fold content earlier (at a higher priority) and defer those not required until later in the process. You can see the priority given to files in the Network tab in Chrome Dev Tools. Just right-click on the bar, select Priority, and add it as a column.
What it’ll do is take a file that may have started downloading later, and download it as soon as possible. Again, the other benefit is that where the preloaded file would have been render-blocking before, that will no longer be the case.
Combined with what we mentioned above for making CSS async, preload just adds another line that is meant to get the file faster by setting the browser priority higher than normal. This will also work for browsers where preload is not supported.
Code examples:
<link rel="preload" href="/my.css" as="style"><link rel="stylesheet" href="/my.css" media="print" onload="this.media='all'">
Choosing Which Files To Preload
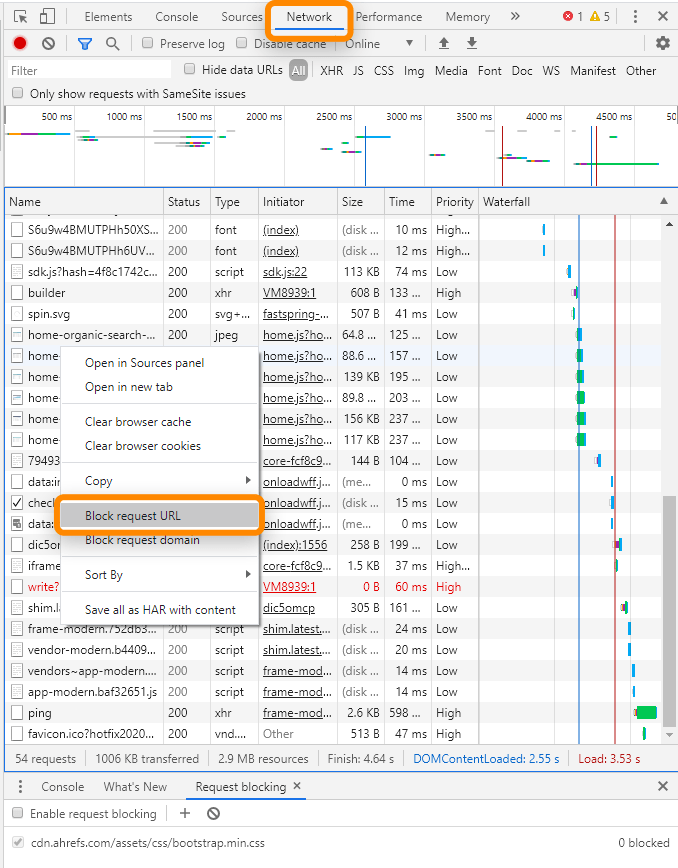
Usually, you’re going to have the main theme file that contains a lot of the CSS for the website. Devs will often name this after the theme, or call it “style,” or sometimes name it after the website itself. If you have trouble identifying this file or believe that other files may need to be preloaded as well, then the easiest way to check is by using the request blocking feature within Chrome Dev Tools. Open the Network tab and load a page to see the files requested. You can right-click on these to add them to the block list. When you reload a page, if the page still looks normal, then you probably didn’t block a file needed for the above the fold content. When you get one of these that breaks how the page looks, that’s an indication it’s needed to render the content above the fold and is a file you want to preload.
[amazon box=”B0819H77TB” “small”]
Things To Know About Preload
- You need crossorigin on fonts or you’ll get a double load of the file.
- You still need the normal file calls for JS + CSS, so don’t delete those.
- You can preload a font even if it’s called in another file like a CSS file.
- Be careful how much you preload. You can run into issues trying to preload too many files.
Server Push
This was part of the HTTP/2 (H2) specification. It allows a server to deliver a file without it being requested. So instead of a chain that might be HTML > CSS > Font, this allows a site to say I’m going to need that font, just send it.
Server Push is problematic, and I typically recommend against it, but if you are a great developer or have access to one, you can give it a shot. It requests files from the server on the same connection as the page request. Server push can load assets twice. There’s a workaround using cookies and checking if you’ve already pushed assets to users, but it’s a complex implementation. There’s another problem involving connection issues that can cause files not to load at all. With all of the extra work, you still may not see significant gains over preload because browsers check the page cache (where preload is) before the push cache.
Filetype JavaScript
JavaScript can also be complex, with a lot of options and a lot of considerations. Sometimes it is used to provide functionality, sometimes it’s used to pull in the main content, and sometimes it’s even used to make changes to the CSS. Furthermore, certain code may need other code to run properly. These are known as dependencies, and changing how JavaScript is loaded may end up breaking some functionality of the page.
If JavaScript plays a critical role in content or the styling of the page, or if it’s the core system—as is the case with many JavaScript frameworks—then many of the same rules as CSS apply as far as inlining and preloading. However, you also have the option of Server Side Rendering (SSR). This processes the code and renders a snapshot. For instance, if JavaScript is used to populate items on the page or for the menu, you may want this information earlier in the load or reduce some of the burden of the client’s browser, you may want to use an SSR solution.
The easiest way to see if JavaScript is needed on the page is to click the padlock in Chrome and open up Site settings. You’ll see a list of Permissions with one being JavaScript where you can either Allow it or Block it. Blocking JavaScript, reloading the page, and comparing the site with and without JavaScript should show you if any elements are missing from the page or not. If something is missing, re-enable JavaScript and go through the same blocking process as we went through with CSS above to find out which files are critical to the rendered content.
Move to Footer
For inline scripts, you may consider moving them to the footer. Remember that JavaScript is parser blocking, which means it’s blocking the HTML from being read. Moving these scripts to the footer ensures that much of the data can be processed before any blocking occurs. You have other options for script references that are probably better, such as defer and async.
Defer/Async
Defer and Async are attributes that can be added to a script tag. Usually, a script being downloaded blocks the parser while downloading and executing. Async will let the parsing and download occur at the same time but still blocks during script execution. Defer does not block parsing during download and only executes after the HTML has finished parsing.
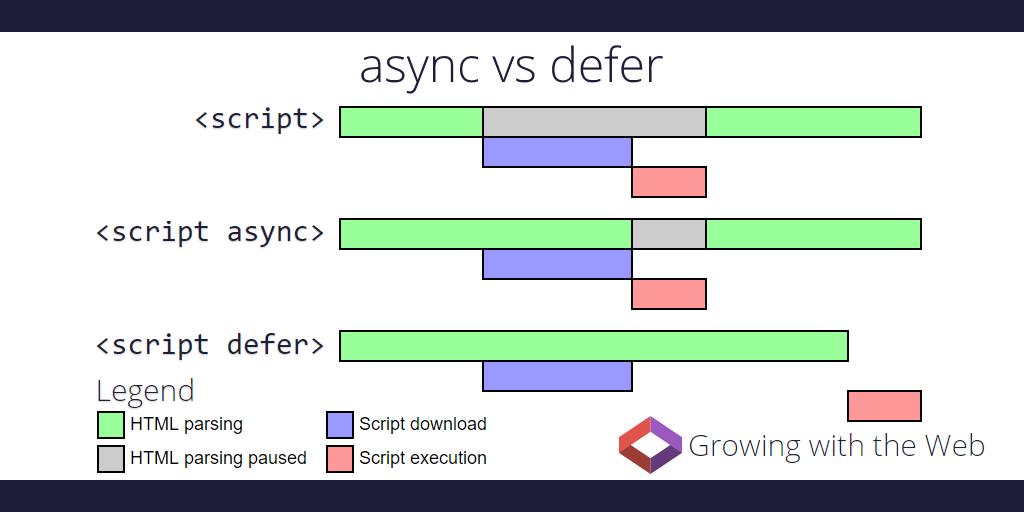
Source: https://www.growingwiththeweb.com/2014/02/async-vs-defer-attributes.html.
Defer/Async code samples
Normal:<script src="https://www.domain.com/file.js"></script>
Async:<script src="https://www.domain.com/file.js" async></script>
Defer:<script src="https://www.domain.com/file.js" defer></script>
Addy Osmani has a nice breakdown of blocking, async, defer, and preload and how it impacts browser priorities.
Responsiveness
Responsiveness is typically measured by First Input Delay (FID), which is the time from when a user interacts with your page until it can respond. Max Potential FID is the worst-case FID your users may experience. Many people typically measure Time To Interactive (TTI), which is how long it takes for a page to become fully interactive.
Remember the things we mentioned earlier were happening on the main thread? Well, there’s just one main thread, and JavaScript competes for those resources. While the thread is blocked, it can’t respond to user input—so the page feels slow. When a user clicks and the page doesn’t do whatever action they requested promptly, they feel that delay. When this happens, your users may let you know and not in a nice way.
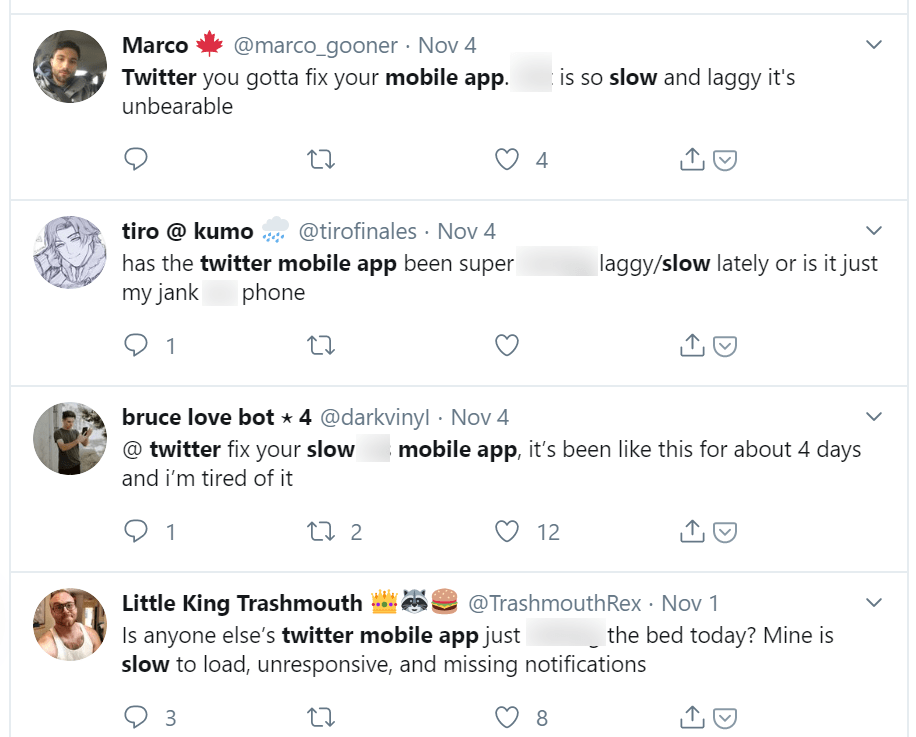
Users complaining about the slowness of Twitter’s app… on Twitter.
What impacts responsiveness is JavaScript. All the JavaScript loaded for all the different things it can accomplish has to run in the same place.
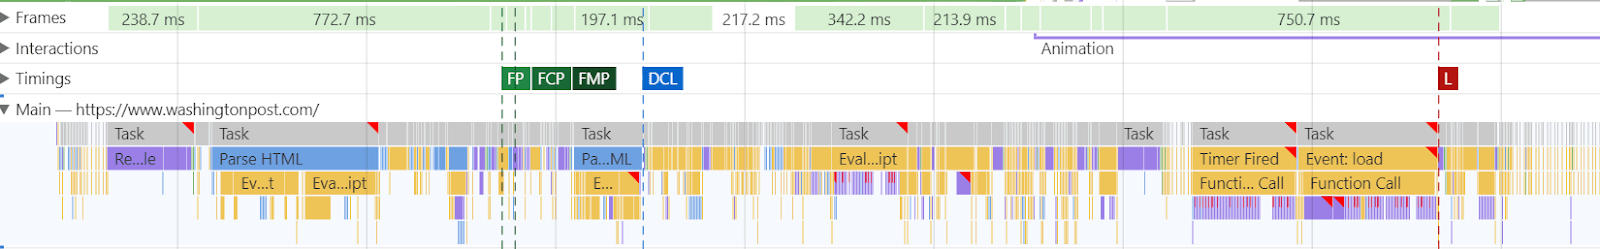
The image above is what the main thread looks like. Those red tick marks in the Performance tab in Chrome Dev Tools indicate where there may be some issues. Usually, tasks taking too much time to run on the main thread are the ones flagged. Each of those is where the page is overloaded with work and can’t respond to user input promptly.
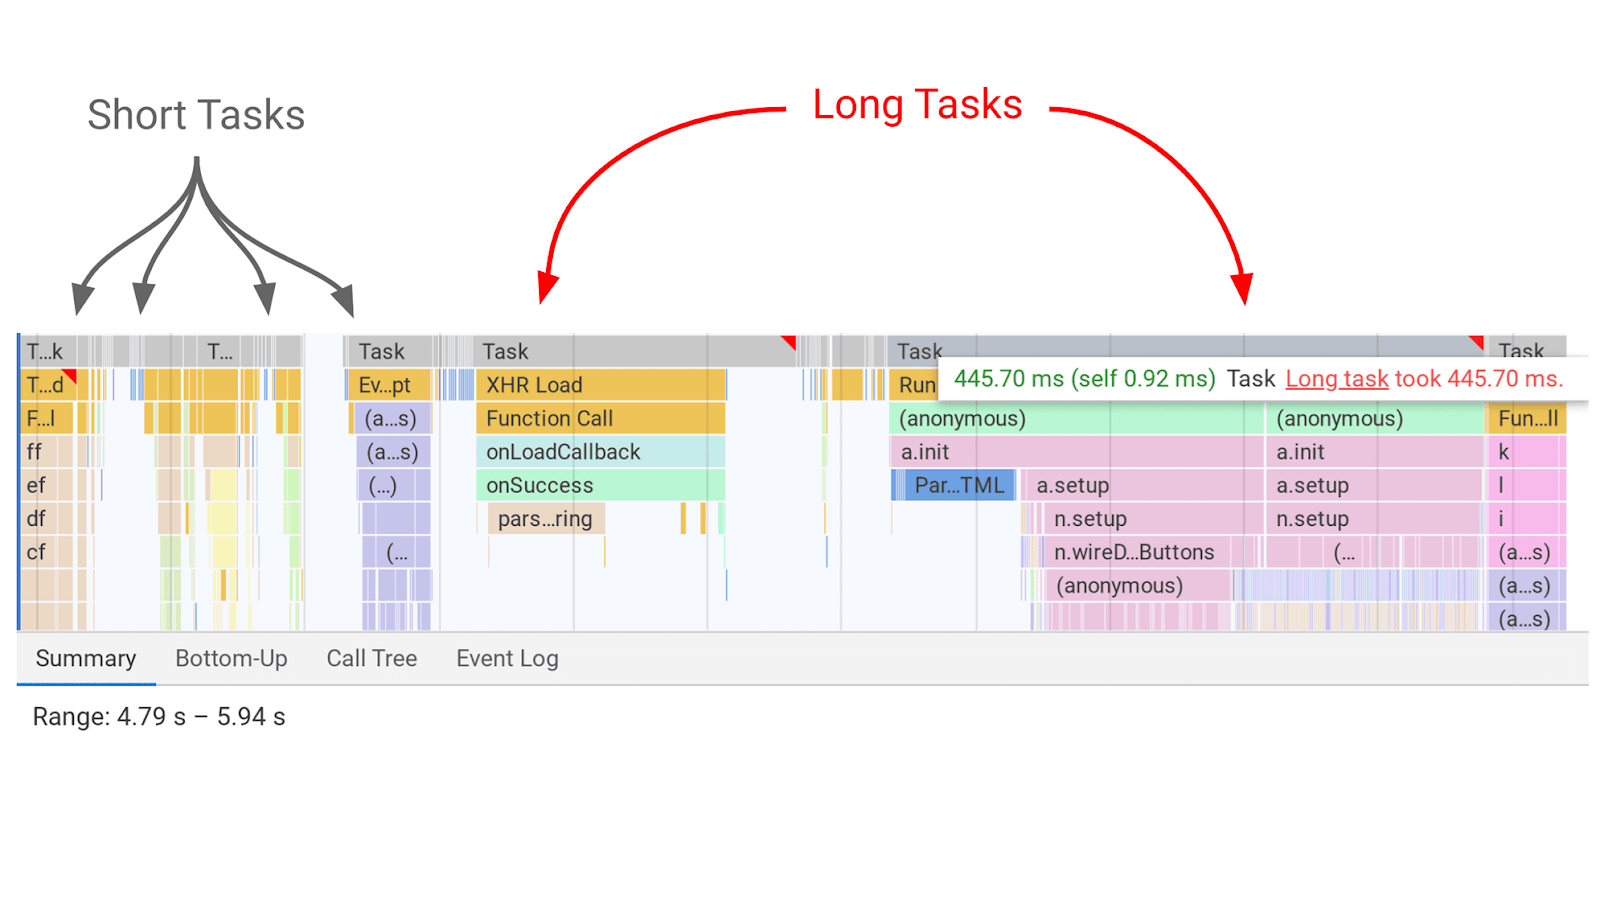
Source: https://web.dev/long-tasks-devtools
While a task is running, a page can’t respond to user input. This is the delay that is felt. The longer the task, the longer the delay experienced by the user. The breaks between tasks are the opportunities that the page has to switch to the user input task and respond to what they wanted.
Third-party tags
This is another report you can find in PageSpeed Insights. It shows the size and how long third-party scripts were blocking the main thread and impacting interactivity.
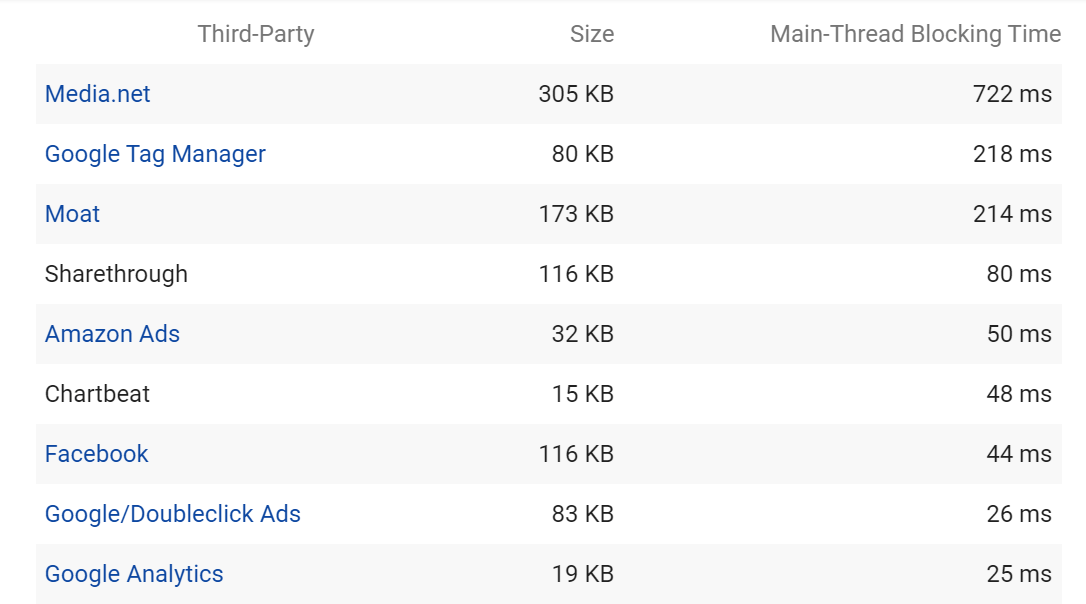
Note that, especially with tag managers, some things may count toward the tag manager and not the script that’s the problem. It might be part of the script in the container counting for a tag manager and not counted properly towards the third-party script.
Use the size and main thread time to determine what you may be able to get rid of. Remember that most third-party scripts add some kind of functionality, tracking, or targeting, but rarely are they necessary for a page to function properly. Use your discretion to determine if the data gained is worth the extra load time for these scripts.
Common Sources of JavaScript Bloat:
- Jquery
- A/B testing systems
- Heatmap systems
- Real User Monitoring (RUM) systems
- Live chat systems
Cleanup Options:
- Use fewer tracking/scripts. This can be a hard decision as marketers like data, but sometimes the amount of data being collected is just absurd.
- Consolidate systems with similar functionality, like if you are running multiple analytics systems or multiple systems that have user information. Many programs have multiple functions, and sometimes you end up with scripts that have the same or similar functionality to another script when maybe you can do without one of them.
- Segmentation. For example, some A/B testing systems will store and force you to load a list of all tests currently in the system, bloating the size of the download. Many times you can segment by section of the site and create smaller versions of the file.
- Server-side tracking instead of client-side. There are tradeoffs with tracking this way I won’t cover here, but you can find a lot of resources on why you might use one over the other.
- Use web workers to move processing off the main thread. The downside of doing this is the web worker won’t have access to the DOM. This is also fairly advanced and requires skilled developers.
- Service Workers / Edge Workers. I’m excited for what the future holds with this technology. It’s basically allowing JS to run at the Edge (or CDN level) instead of on the client browser. So before for an A/B testing system, it might be that a file is downloaded and then processed and executed on the client browser. Because the test might overwrite parts of the DOM and happen later in the load, you might see visual flashes as things change. Now, you could basically pre-process the changes that were going to be made and deliver them inline with the HTML that’s delivered to bots and users.
- Simply delay the execution of the load of a file if it’s not needed right away or only initiate the file request based on an action like a click. For example, a live chat system probably isn’t needed in the first five seconds of the page load, so delay it. You can also request the file after someone hovers or clicks on a button so it’s not loaded with the initial page at all. Or use an image with a play button instead of embedding a YouTube video and only load in the YouTube video elements and play the content when a user clicks.
Benefits of JS Frameworks:
JavaScript Frameworks like React, Angular, and Vue have some benefits over traditional systems.
- Tree shaking: Delivering only code used on the page. Any additional files or code not needed are not loaded, so it results in smaller files and smaller pages. It eliminates the code traditionally required for every other page and possibility.
- Code splitting: Splitting files into smaller chunks, so there are more opportunities for interactivity. For example, let’s say you have a 1MB JS file that runs as a long task on the main thread and blocks interactivity while it runs. You can split it into 50KB chunks so tasks won’t run as long, and there are more spaces in between at shorter periods where a page could respond to user input.
Filetype Fonts
With fonts, you have many of the same options as we mentioned before (e.g., inlining or preloading a needed font). You’ll find some code samples for preloading fonts here if you want to go that route. However, with fonts, what I would recommend is using font-display: swap;, which simply uses a default system font until the custom font is ready and then swaps in the custom font. This is relatively easy to do in your stylesheet.
@font-face {
  font-family: 'Whatever';
  font-display: swap;
}
If you’re using Google fonts, it’s even easier. All you need to do is add &display=swap as a parameter in the URL.
<link href="https://fonts.googleapis.com/css?family=Whatever&display=swap" rel="stylesheet">
Filetype Images
The main concern with images is their size and weight. You want optimized images that are loading the right size for the right device and with the right quality.
Images are loaded asynchronously, so they’re not blocking the load of the page, but they can add to the weight and overall time to interactive.
Another potential issue has to do with prioritization, where some images may not be prioritized correctly or prioritized before critical files like CSS and JS. I won’t go into detail on this, but you can find more details and some information on how to troubleshoot here and here. There can also be conditions where many images load, maxing out resources such as the bandwidth and slowing down the overall page load.
Many of the things we have talked about, like inline and preload can be used for images but with the same trade-offs like caching or complexity. The number one rule is not to use a lot of images or large images above the fold in your theme. You don’t have to show your giant background images on mobile devices. People can live without them. If you must show the images, what I’d recommend is preload, and this is covered pretty thoroughly by this guide.
There’s a great guide covering image optimization and different formats at https://images.guide/.
Always do image optimization in a scalable way. There are lots of options to do this at different levels like with the CDN, server, by the CMS, with an API, etc. Here are a few options:
Image optimization CDNs:
Akamai Image Manager
imgix
Image Engine
Cloudinary
Uploadcare
Image optimization APIs:
ShortPixel
Fastly Image Optimizer
Kraken.io
TinyPNG
Imagify
GUI:
ImageOptim
Squoosh
Command Line:
Imagemin also has an npm module if you’re using webpack, gulp, or grunt
JPEG:
Guetzli
MozJPEG
PNG:
pngquant
Zopfli
WordPress/Drupal
I don’t have any particular recommendations. You’ll find a lot of options for WordPress and Drupal.
Lazy Load Images
If someone tells you they need to “defer offscreen images,” this is what you need. It is basically delaying the loading of images not above the fold because they’re not needed yet. Once a user starts scrolling, the images will load in.
I’d say you want a library that uses IntersectionObserver but probably has a polyfill because of browser support. The most popular library for this is lazysizes, but you’ll find many options for your setup.
As of Chrome 76, lazy loading has been brought into the browser. I expect more browsers to do the same soon, but for now, we may want to use this method for Chrome with a polyfill for other browsers. You can find more info here. WordPress added lazy loading by default in version 5.4.
Responsive/Resized Images
This is all about serving the right image for the right screen. Loading a large image and then scaling it down just wastes time and resources. There are again a lot of automated solutions for this. For example, many CDNs will handle it, and there are also things like the sharp npm package, the ImageMagick CLI tool, or various plugins/modules for different systems.
Changing Image Formats
Different formats like webp can be better but are problematic due to browser support. You either have to do a lot of detection and swapping or use a service that does it for you. There are plenty of guides, but it’s not something I’d recommend most people tackle unless you can find an easy, automated way.
Page Size / Weight
This is the size of all the resources combined. Smaller pages are faster. We’ve already talked about many of the improvements like minification, compression, and simply getting rid of anything not used. The less a page has to load initially, the faster the page will display.
The goal should be a minimal amount of data to get the content above the fold loaded as quickly as possible. You can then load the rest of the information needed on the page after, all while keeping everything as small as possible. Problems usually come from unused code, images, and general website bloat related to functionality or tools. The reason I’m giving this its own section is that you should be considerate of the overall amount of data your page is using.
Other Web Performance Opportunities
There are a lot of options for things you can do to improve your page speed. I’m going to cover a few more important ones, but there are many more opportunities out there because page speed is such a complex topic.
Caching
A cache is simply a stored copy of a file. Cached files can be reused on the next page without having to download them again.
Server Cache
This is where files come from when a browser requests them. Ideally, you want to hit the closest cache to the user. What I mean by that is that caches can be stored at many different levels with different TTLs set for each one that cause the cache to expire. There’s a balance between caching for longer periods and having the content update quickly with changes. It’s not quite that straightforward as you can clear the cache through different layers when an update is made, which is the ideal way to do this along with a cache warming system. Cache warming systems send a bot to rebuild the cache rather than waiting for a user to request the files, meaning a user never has to wait as the initial cache is built.
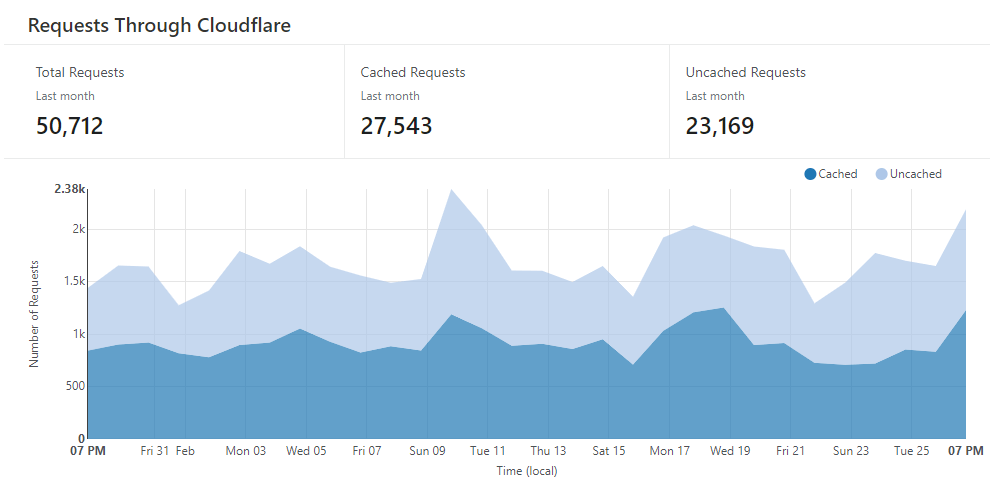
A check usually goes something like: CDN cache > Server cache (like Varnish) > Origin (has to build the page on the fly). Generally, a higher level cache like the CDN is going to be faster, so you want most of your hits to be at that level.
For example, on one of my sites on Cloudflare shown below, I have a little more than 50% cache hit rate for the CDN level. Unfortunately, that means many requests aren’t served by the CDN and have to go back to the server-level cache. Or, if there’s no current cached version there, it will have to build the page on the fly, which uses a lot of database resources and is going to be slower for a user.
Browser Cache
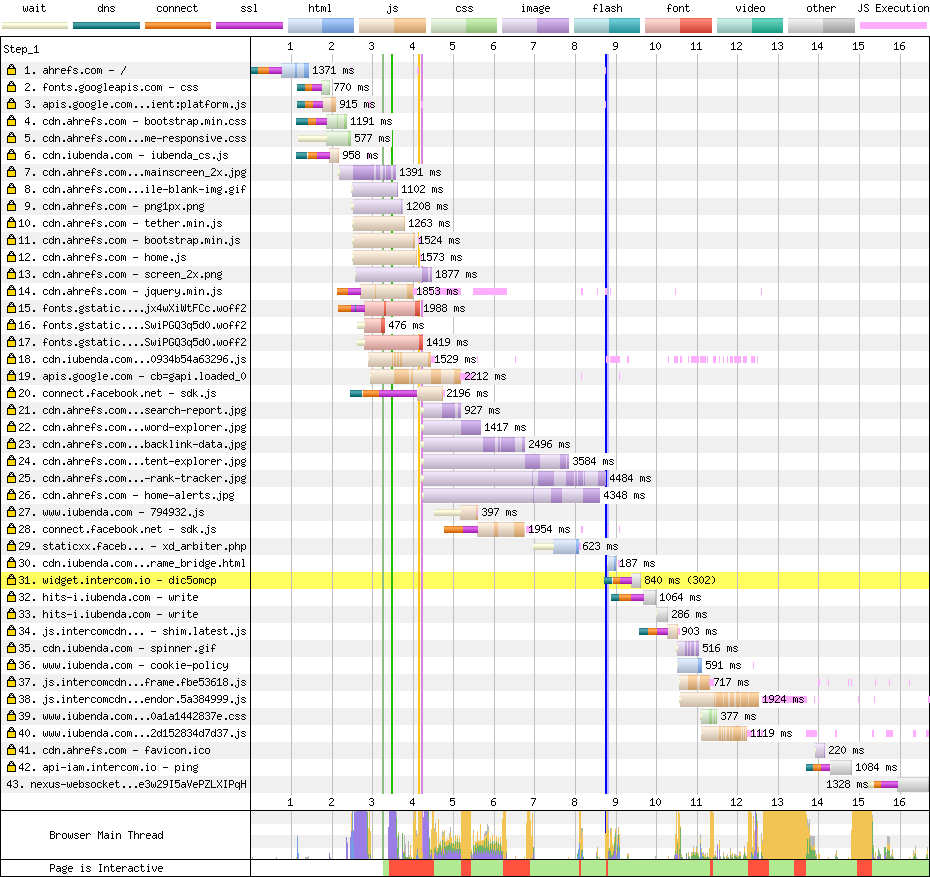
Even if you have a large website that tests poorly on page speed, there can be a considerable difference between the first and second load of a page or navigation between pages. A lot of what we’ve talked about up until now was focused on making the initial load faster. This is what most testing tools see and is a user’s first impression of your website. When a user visits a page, a browser can cache many of the files locally on the person’s computer, which can be re-used for subsequent page views.
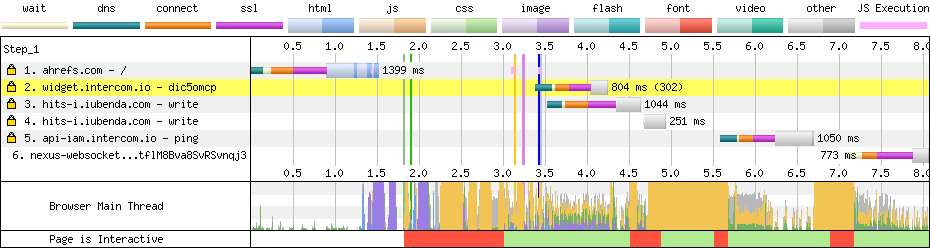
For example, look at the difference between the first and second load for Ahrefs. Most of the files that had to be downloaded on the first load are cached on the client-side (browser), meaning the second load can just reuse the ones already downloaded to build the page. Cutting out the connection time and downloads means the page loads significantly faster. In this case, First Paint occurs roughly twice as fast in the second load.
1st load:
2nd load:
You’ll see caching issues flagged in tools like Lighthouse as “serve static assets with an efficient cache policy.” Setting the length of time for the cache varies by system, but generally, what you need to do is use a Cache-Control HTTP response header. The max-age is the time you want it stored in seconds and can be set like: Cache-Control: max-age=31536000
Varvy has a guide for setting cache controls on different servers that’s worth reading.
[amazon box=”B07VJ92G95″ “small”]
Set a Performance Budget (Maybe)
A performance budget is a set of self-imposed limits on metrics that impact performance. It can be things like size, the number of a certain type of file, or some of the speed metrics we’ve talked about. Setting a budget can help get the conversation started. Learn more here.
Adaptive Loading
Adaptive loading adjusts what is loaded and when to make sites more progressive in how they load. Priority features and functionalities are loaded first, and the rest are loaded later based on things like the CPU, memory, or network speed. So, having fewer resources available means a stripped-down version of the site may be delivered, but people with more resources available will get the whole experience.
One part of this is the Network Information API, which gives you information about the user’s connection. You can change your images/content or do things like turn off videos based on the network information of the incoming request. Many of the image CDNs do this using the Network Information API.
Use Other Resource Hints
Prefetch
Prefetch is a resource hint that gets a file before it’s needed. This can be for entire pages, scripts, or CSS files. One of the best ways to use this is with Guess.js, which uses predictive prefetching. Guess connects to your Analytics and fetches the most likely next page based on current user behavior.
Preload
We’ve talked about preload a bit already, but this is a slightly different use case. You can preload resources based on things like a user hovering their mouse over a link or links within the current viewport. While this can be somewhat resource-intensive, it ensures that the next page loaded will appear much faster.
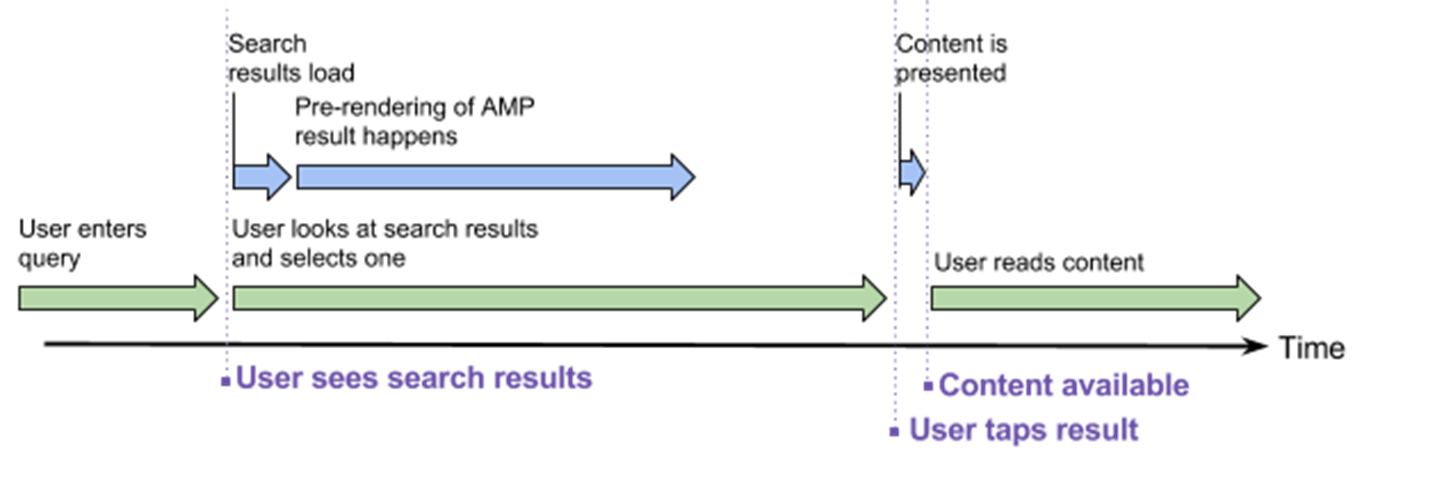
AMP
AMP preloads in the SERP, so part of the site is already loaded before clicking. AMP has the benefit of having the visual load of the page done before even clicking. AMP looks faster than normal web pages when coming from the search results because the visible portion of the page is already loaded.
Source: https://www.ampproject.org/latest/blog/why-amp-caches-exist/
There are many other performance enhancements and file size limitations within AMP that make it worth considering. Still, it is yet another system to maintain and has some other tradeoffs you probably want to look into before diving in.
Page Speed Testing And Tools
Lab Data vs. Field Data
Lab Data: Characteristics are a controlled environment, repeatable process, and control of settings. PageSpeed Insights is a great example. The test runs in the same environment with the same settings, and the results will be roughly the same with each run.
Field Data: Real User Monitoring (RUM) is how users experience the page. It takes into account everything like caching, devices, networks, etc., but is limited on metrics and the ability to debug.SIDENOTE. Be careful about how long you use Real User Monitoring (RUM) tools that allow you to collect field data. While these tools are great to see how the pages are loaded for users, they can also increase load times. Your goal is to make your site faster, and these can be helpful with diagnosing problems, but leaving them on can cause your pages to load slower.
Tools to Measure Page Speed
Google Tools
- TestMySite — Contains a speed scorecard where you can evaluate your speed vs. competitors, has an impact calculator so you can estimate the impact speed is having on your business, and allows you to build a report that includes these and some recommendations on things to focus on.
- Lighthouse (in Chrome Dev Tools) — Allows for testing performance of pages and apps.
- PageSpeed Insights — Runs Lighthouse and provides recommendations. Running Lighthouse in your browser is impacted by so many things like your computer, your network, extensions in your browser, etc. PageSpeed Insights allows for a fairly stable test environment that doesn’t even use your server resources like a Lighthouse at scale setup would.
- Chrome Dev Tools — Lots of useful features to see what and how a page is loading like the Network and Performance tabs.
- Chrome User Experience Report (CrUX) — A public dataset of real user experience data for those opted into sharing in Chrome that covers millions of websites. Field Data (data from actual users) for page speed.
- Web.dev — Another Google testing tool backed by Lighthouse. It also has a section for learning more about page speed.
Other Popular Speed Tools
- WebPageTest
- Sitespeed.io
- SpeedCurve
- Calibre
- Rigor
- New Relic
- Boomerang
- Batch Speed
- GTmetrix
- Pingdom
- SpeedMonitor.io
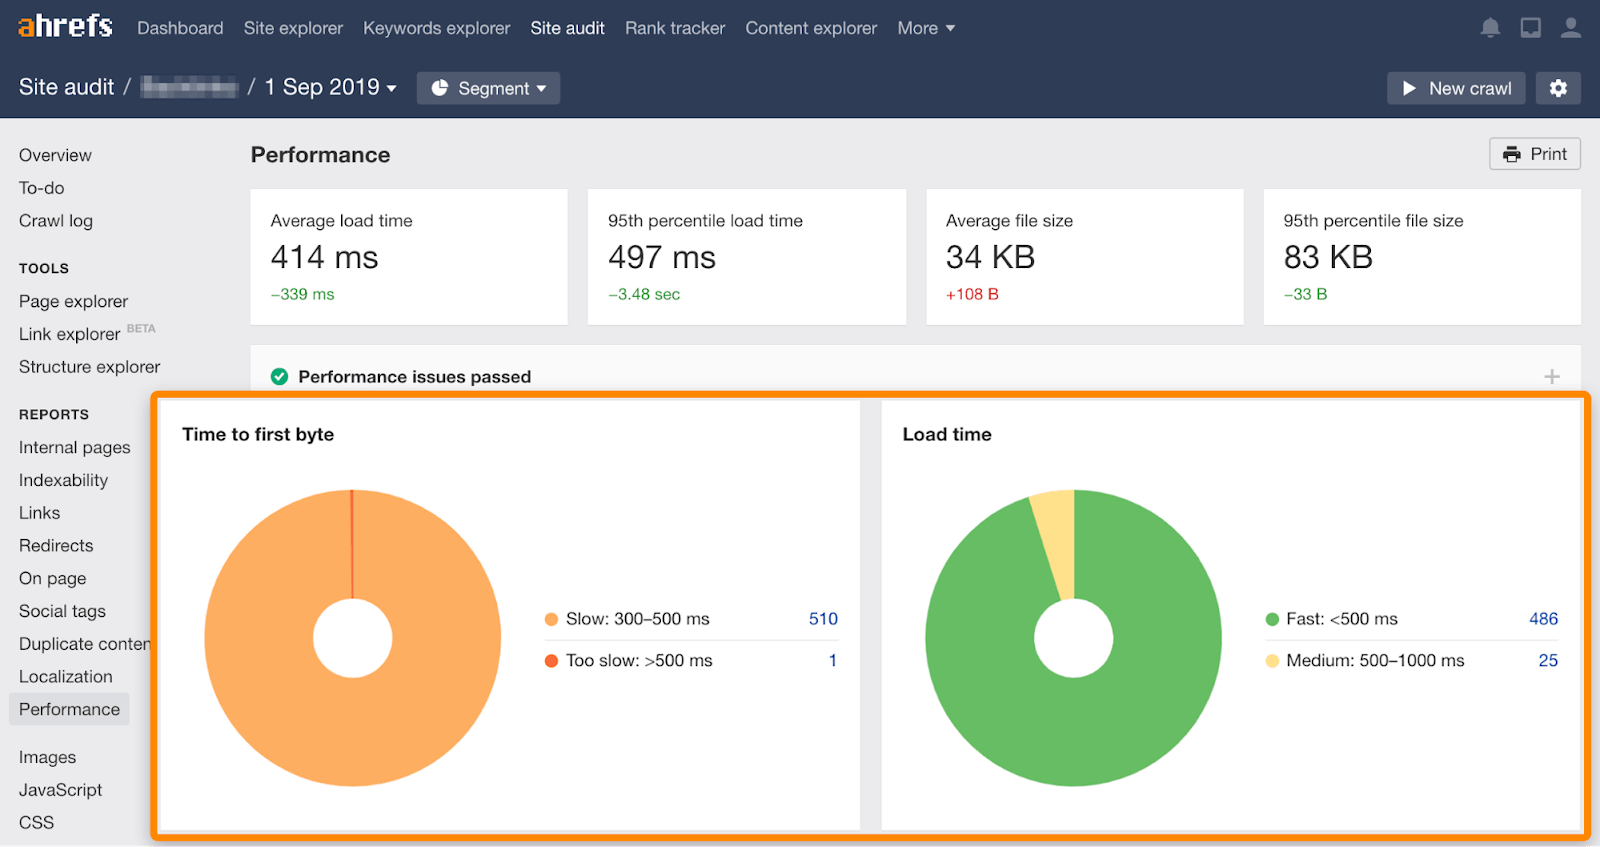
Site Audit > Performance
Ahrefs’ Site Audit tool contains some information about page speed as well. There’s a report for TTFB and for Load Time, which is how long it took us to download the page.
What I personally tend to use:
- Pagespeed Insights — spot-checking individual pages. I also like their API. It allows for 25k tests per day at no cost and comes back with a lot of metrics, including CrUX page-level data. I will say that I don’t pay much attention to the overall score, but I know a lot of people focus on this one metric. As we’ve seen, speed is complex, and you may be improving on some metrics while not helping your score only because of how it’s weighted.
- WebPageTest — the blocking function, filmstrips, video, waterfall, and requestmap. Also, their API for blocking at scale testing (with lighthouse reports also).
- GTmetrix — the chained requests report.
- CrUX – region research, histograms, competitor comparison.
- Web.dev — documentation is great.
What Data is Google Using for Page Speed?
According to Google Webmaster Trends Analyst John Mueller in this video, Google uses the theoretical speed of a page (using lab data) and real field data from users who have tried to use those pages. He says this is similar to the data in the Chrome User Experience Report.
The reality is there hasn’t been any public confirmation of the source of the data they use. While John doesn’t say that they use PageSpeed Insights and CrUX data, the data from those is likely representative of the data being used by Google. My best guess (and this is purely speculative) is that they use measures taken during their rendering process as lab data (potentially by lighthouse, but maybe not), and they likely have an internal resource similar to CrUX that they are using for the field data.
Estimating Impact of Changes
The easiest way to estimate impact is to make a static copy of a page. Copy the code to your server and test the page to get a baseline metric. Make changes to the page and test again, and you should get the approximate impact of the changes, so when you make them on your live site, you know the approximate impact.
Final Thoughts
You should make your site as fast as possible for users. Pick metrics that represent how a user experiences the load and interactivity of the page and improve on those. There isn’t really a threshold where I would stop improving page speed, but there is often a stage where the benefit might not be worth the time, effort, costs, or potential tradeoffs (such as losing data from a tool). In general, I’d try to be slightly faster than competitors.